Wir sind miteinander verknüpft
mailto: payer@hdm-stuttgart.de
Zitierweise / cite as:
Entwicklungsländerstudien / hrsg. von Margarete Payer. -- Kapitel 1: Einleitung / zusammengestellt von Alois Payer. -- Fassung vom 2018-10-09. -- URL: http://www.payer.de/entwicklung/entw01.htm. -- [Stichwort].
Erstmals publiziert: 1998-10-26
Überarbeitungen: 2018-10-04/09 ; 2018-09-14/19 [grundlegend überarbeitet]; 2001-01-29 [Update]; 1998-10-29 [Hinzufügen einer Weltkarte nach dem HDR 1998]; 1999-04-25 [Hinzufügung von Bestell-Links zu amazon.de]
Anlass: Lehrveranstaltung "Einführung in Entwicklungsländerstudien", HBI Stuttgart, 1998/99
©opyright: Dieser Text steht der Allgemeinheit zur Verfügung. Eine Verwertung in Publikationen, die über übliche Zitate hinausgeht, bedarf der ausdrücklichen Genehmigung der Herausgeberin.
Dieser Text ist Bestandteil der Abteilung Entwicklungsländer von Tüpfli's Global Village Library.
Das sehr lesenswerte Buch
Rosling, Hans <1948 - 2017> ; Rosling, Ola <1975 - > ; Rosling Rönnlund, Anna <1975 - >: Factfulness : ten reesons we're wrong about the world - and why things are better than you think. -- London : Sceptre, 2018. -- ISBN 978 1 473 63746 7
Nennt zehn instinktive Reaktionen, die unsere Wahrnehmung der Welt stören.
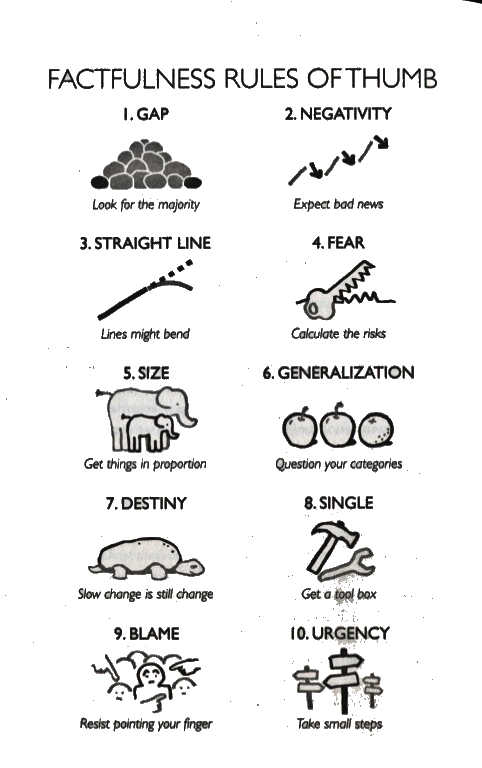
Abb.: Factfulness rules of thumb
[a.a.O., S. 256. -- Fair use]
Der Titel "Entwicklungsländerstudien" wird auch bei der grundlegenden Überarbeitung 2018 beibehalten wegen der Kontinuität der Auffindbarkeit dieser Texte. Man muss aber im Auge behalten, dass der Begriff "Entwicklungsländer" heute nicht mehr angemessen ist.
Der Begriff "Entwicklungsländer = LDCs = Less Developed Countries" ist der gegenwärtigen (2018) Situation der Welt nicht mehr angemessen. Er setzt eine Zweiheit von Entwicklungsländer und entwickelte Länder voraus. Wie Hans Rosling (1948 - 2017) zurecht feststellt, ist das "The mega misconception that the 'World is divided in two'" (Rosling, Hans <1948 - 2017> ; Rosling, Ola <1975 - > ; Rosling Rönnlund, Anna <1975 - >: Factfulness : ten reesons we're wrong about the world - and why things are better than you think. -- London : Sceptre, 2018. -- ISBN 978 1 473 63746 7. -- S. 21ff.)
Ausführliche Materialien zur neuen Weltsicht findet man auf der Webpräsenz dieser drei Autoren:
Gapminder. -- https://www.gapminder.org/. -- Zugriff am 2018-09-14
Rosling schlägt vor, die Länder der Welt aufgrund von Lebenserwartung bei Geburt und preisbereinigtes Bruttosozialprodukt pro Kopf in vier Level (Stufen) einzuteilen:
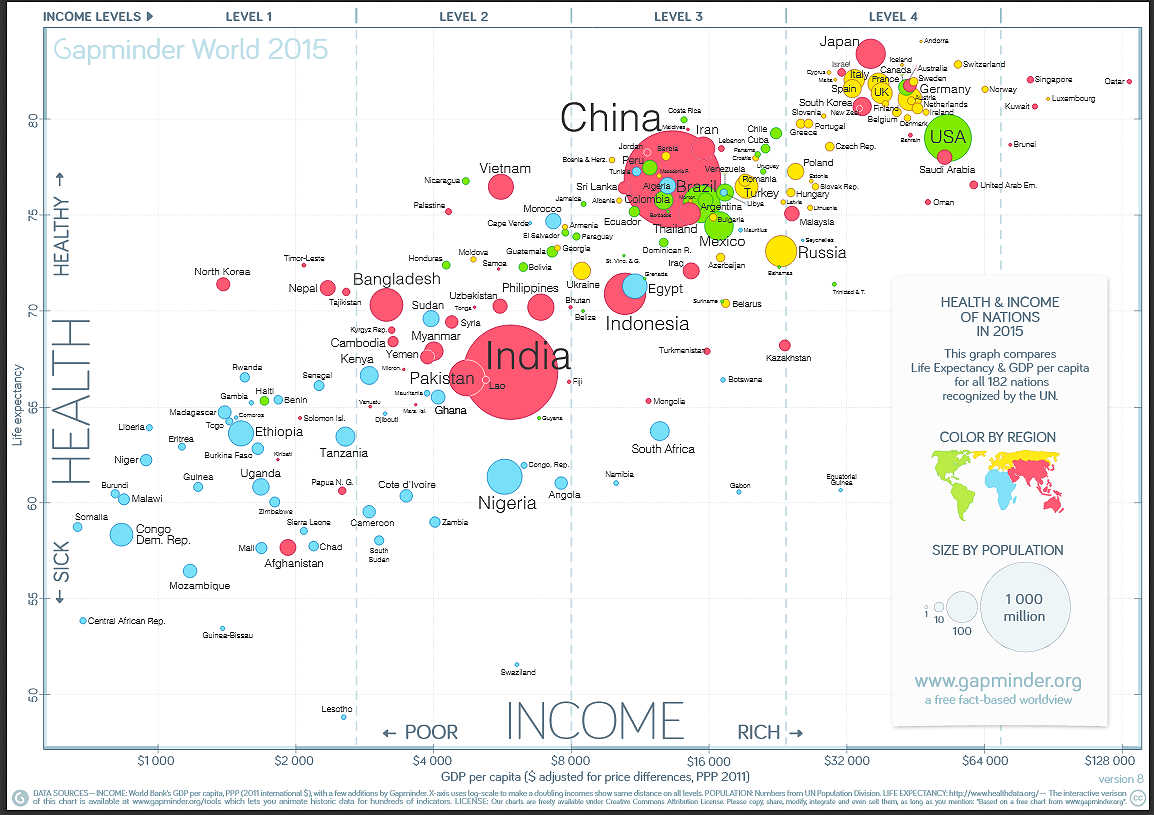
Abb.: Vier Level der "Entwicklung" 2015
[Bildquelle: Gapminder. --
https://s3-eu-west-1.amazonaws.com/static.gapminder.org/GapminderMedia/wp-uploads/20161010170934/countries_health_wealth_2016_v84.pdf.
--
CC BY 4.0]
Wie diese Graphik zeigt, gibt es streng getrennte Dichotomie, sondern ein Kontinuum.
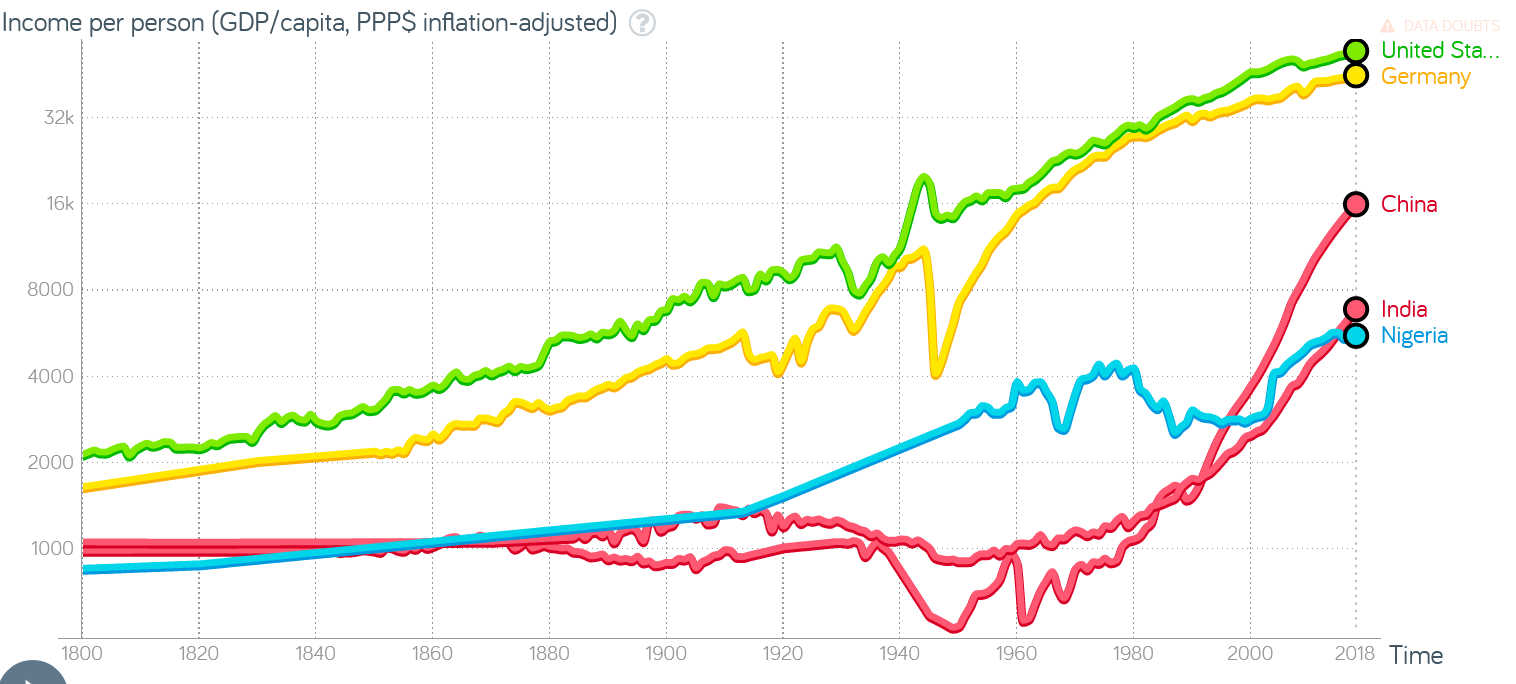
Abb.: Entwicklung des kaufkraftbereinigten Pro-Kopfeinkommen (PPP in $) in USA,
Deutschland, China, Indien, Nigeria, 1800 - 2018
[Bildquelle:
https://www.gapminder.org/tools/#$state$entities$show$geo$/$in@=usa&=chn&=nga&=ind&=deu;;;;;&chart-type=linechart.
-- Zugriff am 2018-10-04. --
CC BY 3.0]
1 Euro ist in Deutschland circa $0,8 PPP wert; 1 Schweizer Franken ca. $1,5 PPP
Die Roslings beschreiben die vier Level in der Art eines Computerspiels:
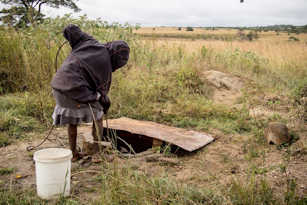
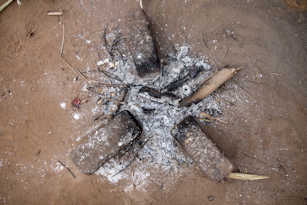
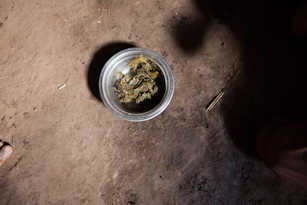
"LEVEL 1. You start on Level 1 with $1 per day. Your five children have to spend hours walking barefoot with your single plastic bucket, back and forth, to fetch water from a dirty mud hole an hour’s walk away. On their way home they gather firewood, and you prepare the same gray porridge that you’ve been eating at every meal, every day, for your whole life— except during the months when the meager soil yielded no crops and you went to bed hungry. One day your youngest daughter develops a nasty cough. Smoke from the indoor fire is weakening her lungs. You can’t afford antibiotics, and one month later she is dead. This is extreme poverty. Yet you keep struggling on. If you are lucky and the yields are good, you can maybe sell some surplus crops and manage to earn more than $2 a day, which would move you to the next level. Good luck! (Roughly 1 billion people live like this today.)"
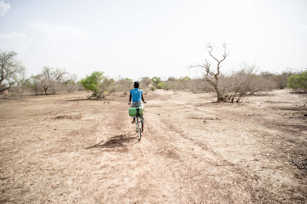
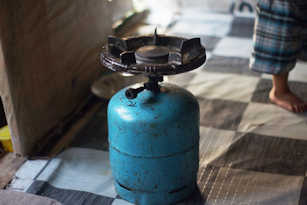
"LEVEL 2. You've made it. In fact, you’ve quadrupled your income and now you earn $4 a day. Three extra dollars every day. What are you going to do with all this money? Now you can buy food that you didn’t grow yourself, and you can afford chickens, which means eggs. You save some money and buy sandals for your children, and a bike, and more plastic buckets. Now it takes you only half an hour to fetch water for the day. You buy a gas stove so your children can attend school instead of gathering wood. When there’s power they do their homework under a bulb. But the electricity is too unstable for a freezer. You save up for mattresses so you don’t have to sleep on the mud floor. Life is much better now, but still very uncertain. A single illness and you would have to sell most of your possessions to buy medicine. That would throw you back to Level 1 again. Another three dollars a day would be good, but to experience really drastic improvement you need to quadruple again. If you can land a job in the local garment industry you will be the first member of your family to bring home a salary. (Roughly 3 billion people live like this today.)"
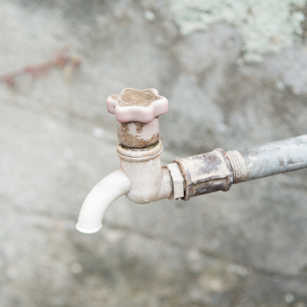
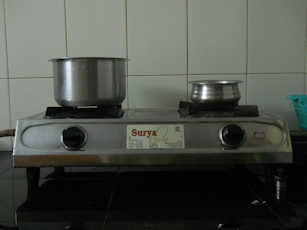
"LEVEL 3. Wow! You did it! You work multiple jobs, 16 hours a day, seven days a week, and manage to quadruple your income again, to $16 a day. Your savings are impressive and you install a cold-water tap. No more fetching water. With a stable electric line the kids’ homework improves and you can buy a fridge that lets you store food and serve different dishes each day. You save to buy a motorcycle, which means you can travel to a better-paying job at a factory in town. Unfortunately you crash on your way there one day and you have to use money you had saved for your children’s education to pay the medical bills. You recover, and thanks to your savings you are not thrown back a level. Two of your children start high school. If they manage to finish, they will be able to get better-paying jobs than you have ever had. To celebrate, you take the whole family on its first-ever vacation, one afternoon to the beach, just for fun. (Roughly 2 billion people live like this today.)"
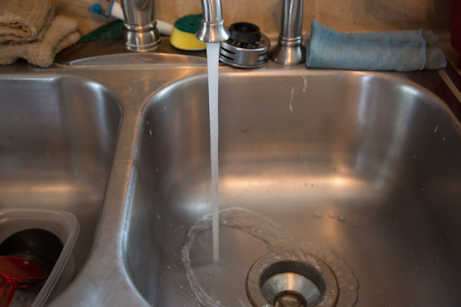
"LEVEL 4. You have more than $32 a day. You are a rich consumer and three more dollars a day makes very little difference to your everyday life. That’s why you think three dollars, which can change the life of someone living in extreme poverty, is not a lot of money. You have more than twelve years of education and you have been on an airplane on vacation. You can eat out once a month and you can buy a car. Of course you have hot and cold water indoors.
But you know about this level already. Since you are reading this book, I’m pretty sure you live on Level 4.
I don’t have to describe it for you to understand. The difficulty, when you have always known this high level of income, is to understand the huge differences between the other three levels. People on Level 4 must struggle hard not to misunderstand the reality of the other 6 billion people in the world. (Roughly 1 billion people live like this today.)""I’ve described the progress up the levels as if one person managed to move through several levels. That is very unusual. Often it takes several generations for a family to move from Level 1 to Level 4. I hope though that you now have a clear picture of the kinds of lives people live on different levels; a sense that it is possible to move through the levels, both for individuals and for countries; and above all the understanding that there are not just two kinds of lives. Human history started with everyone on Level 1. For more than 100,000 years nobody made it up the levels and most children didn’t survive to become parents. Just 200 years ago, 85 percent of the world population was still on Level 1, in extreme poverty.
Today the vast majority of people are spread out in the middle, across Levels 2 and 3, with the same range of standards of living as people had in Western Europe and North America in the 1950s. And this has been the case for many years."
[Quelle: Rosling, Hans <1948 - 2017> ; Rosling, Ola <1975 - > ; Rosling Rönnlund, Anna <1975 - >: Factfulness : ten reesons we're wrong about the world - and why things are better than you think. -- London : Sceptre, 2018. -- ISBN 978 1 473 63746 7. -- S. 34 -38. -- Fair use]
| Level 1 | Level 2 | Level 3 | Level 4 | |
|---|---|---|---|---|
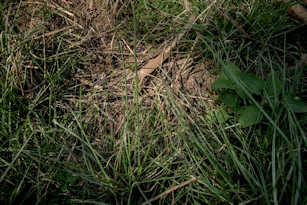
| Wasser |
|
|
|
|
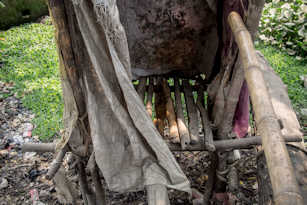
| Toiletten |
 Indien Photo: Zoriah Miller for Dollar Street (CC BY 4.0) |
 Indien Photo: Zoriah Miller for Dollar Street (CC BY 4.0) |
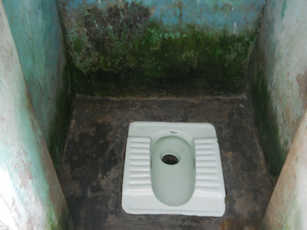 Indien Photo: AJ Sharma for Dollar Street (CC BY 4.0) |
 Indien Photo: Priya Gupta for Dollar Street (CC BY 4.0) |
| Kochen |
|
|
|
|
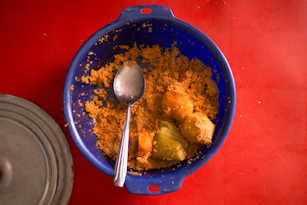
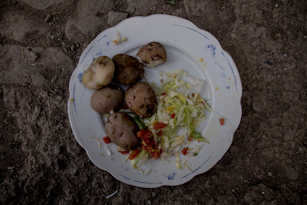
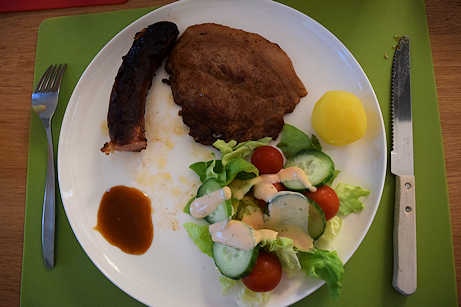
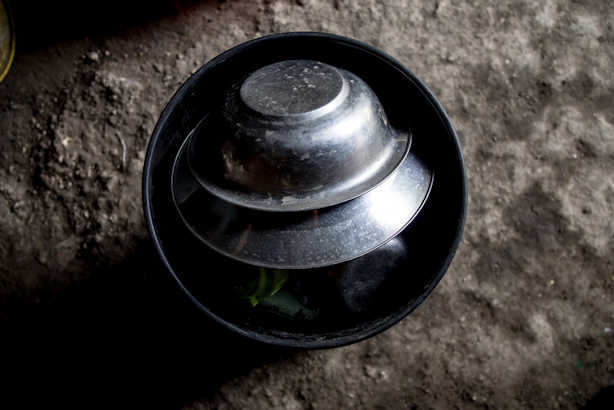
| Essensteller |
|
|
|
|
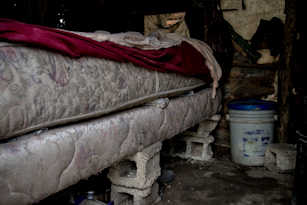
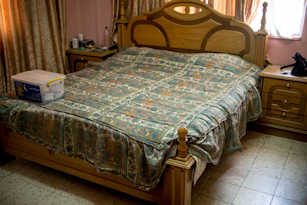
| Schlafstelle |
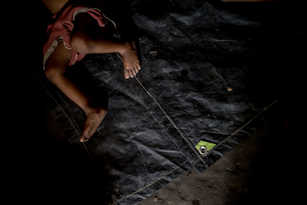 Indien Photo: Zoriah Miller for Dollar Street (CC BY 4.0) |
 Haiti, Karibik Photo: Zoriah Miller for Dollar Street (CC BY 4.0) |
 Jordanien, Westasien Photo: Zoriah Miller for Dollar Street (CC BY 4.0) |
 Mexiko, Mittelamerika Photo: Lucia Rodrigez for Dollar Street (CC BY 4.0) |
| Täglich verfügbar (kaufrkaftbereinigt) | bis $2 | $2 bis $8 | $8 bis $32 | $32 ff. |
| Anzahl Menschen weltweit (ca.) | 1 Milliarde | 3 Milliarden | 2 Milliarden | 1 Milliarde |
| Vorlage (teilweise): Rosling, Hans <1948 - 2017> ; Rosling, Ola <1975 - > ; Rosling Rönnlund, Anna <1975 - >: Factfulness : ten reesons we're wrong about the world - and why things are better than you think. -- London : Sceptre, 2018. -- ISBN 978 1 473 63746 7. -- S. 34-37 | ||||
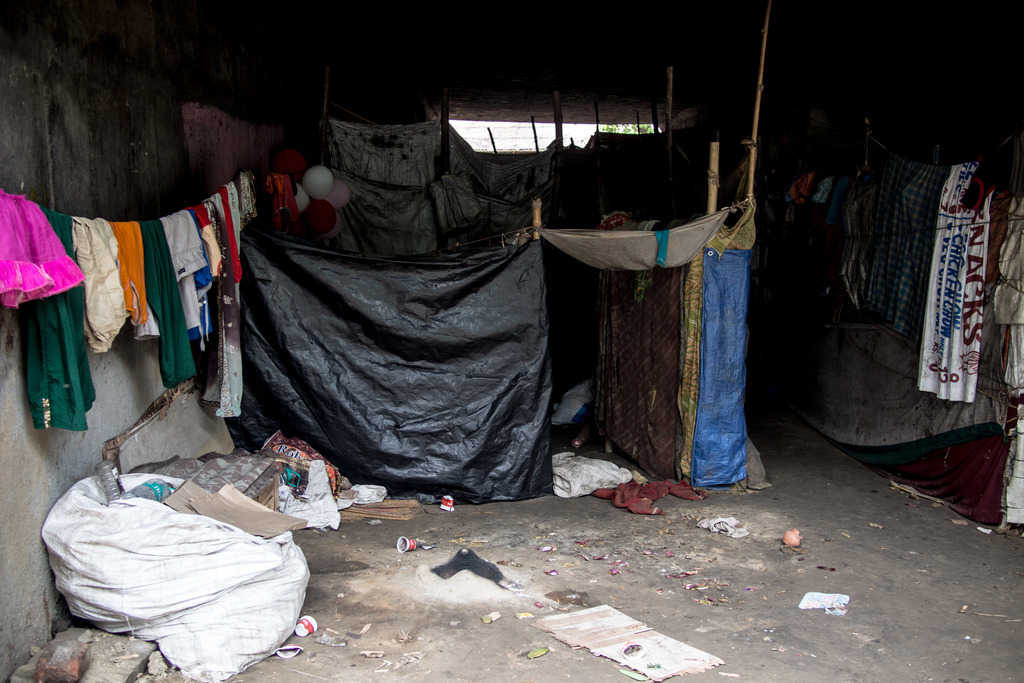
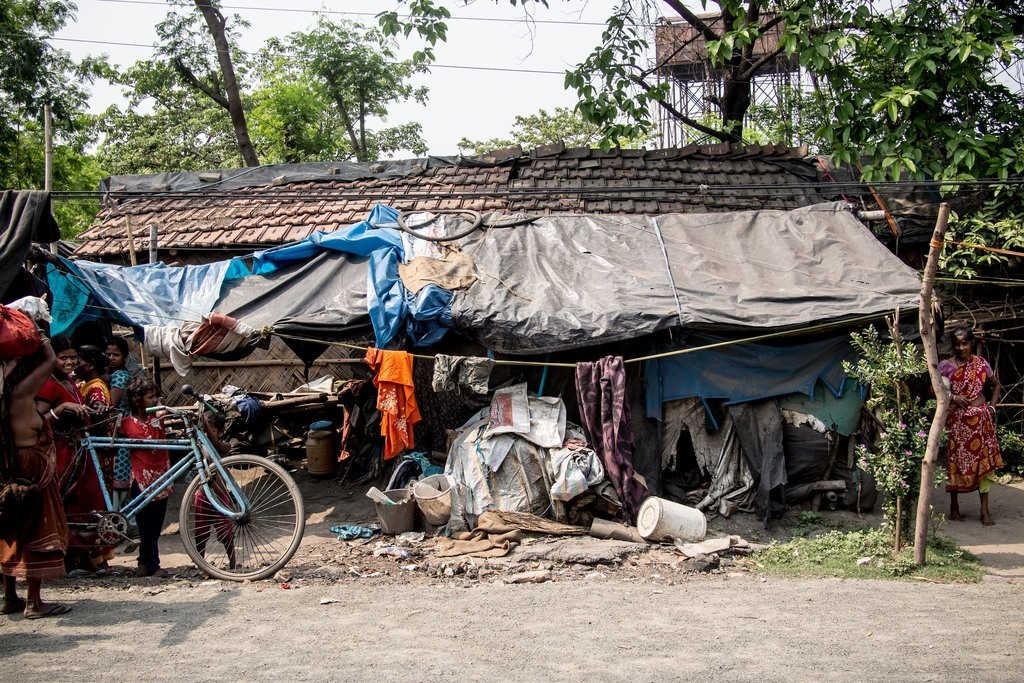
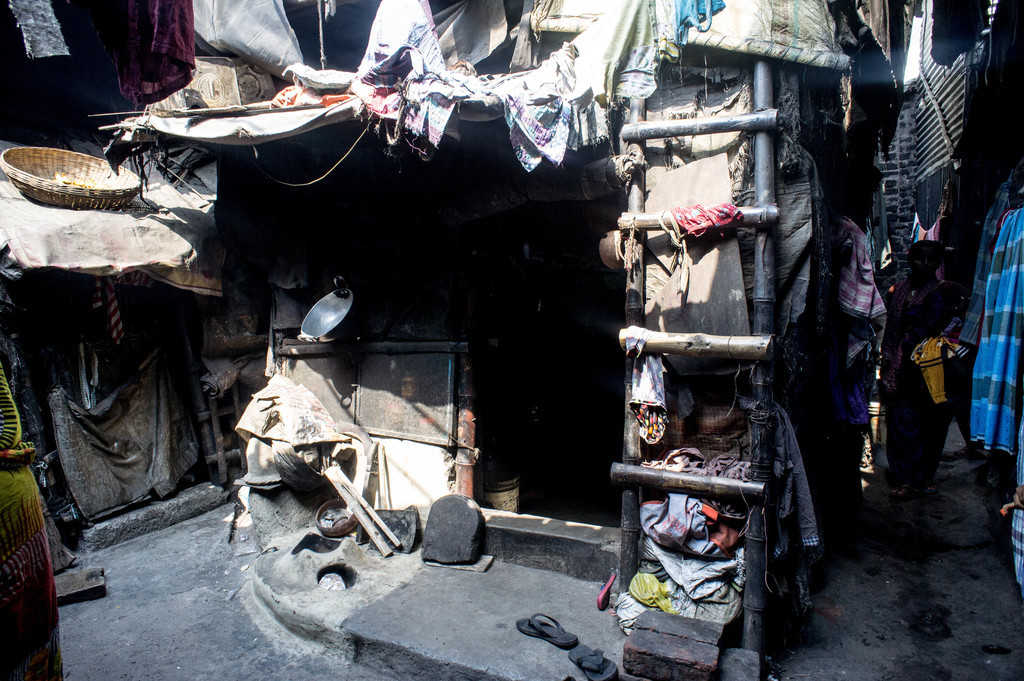
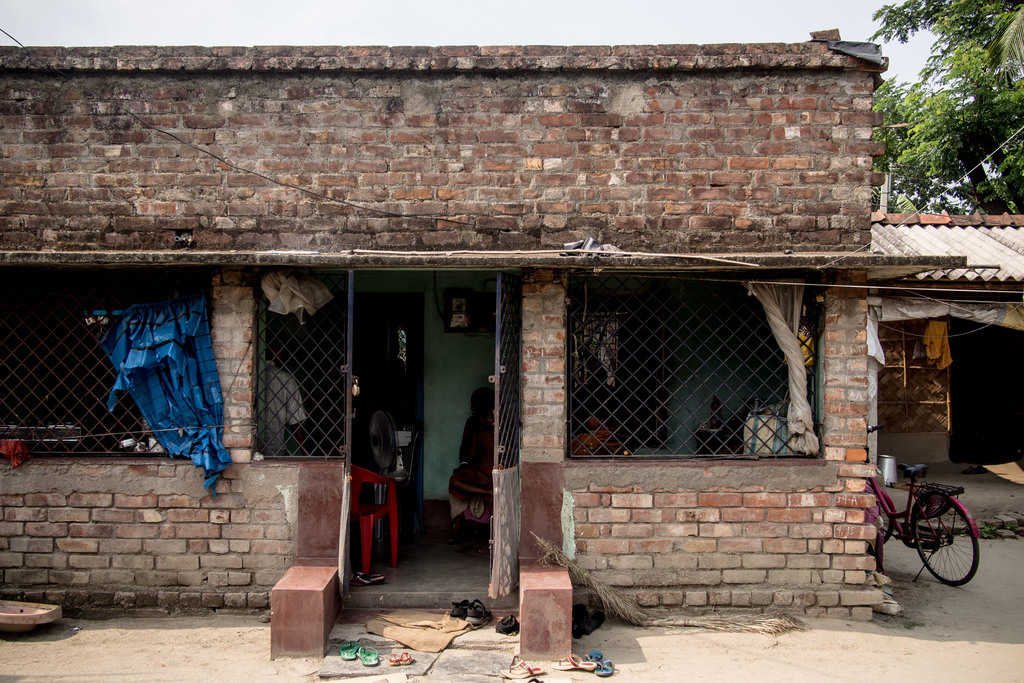
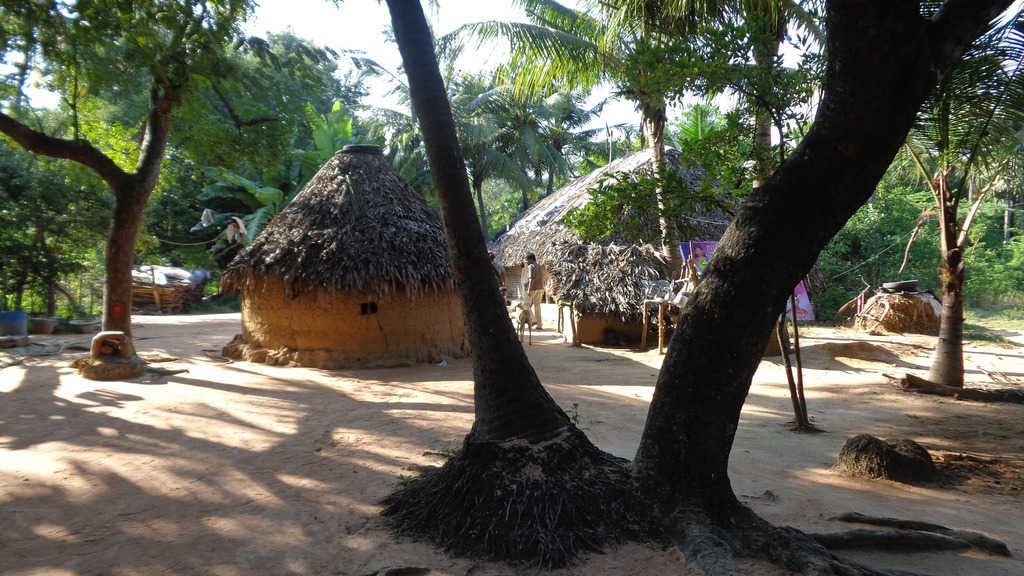
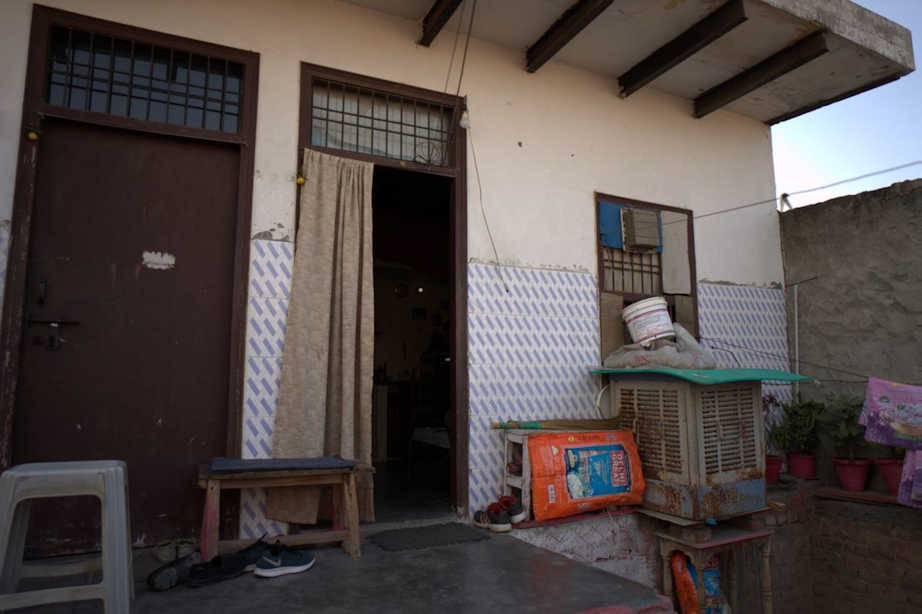
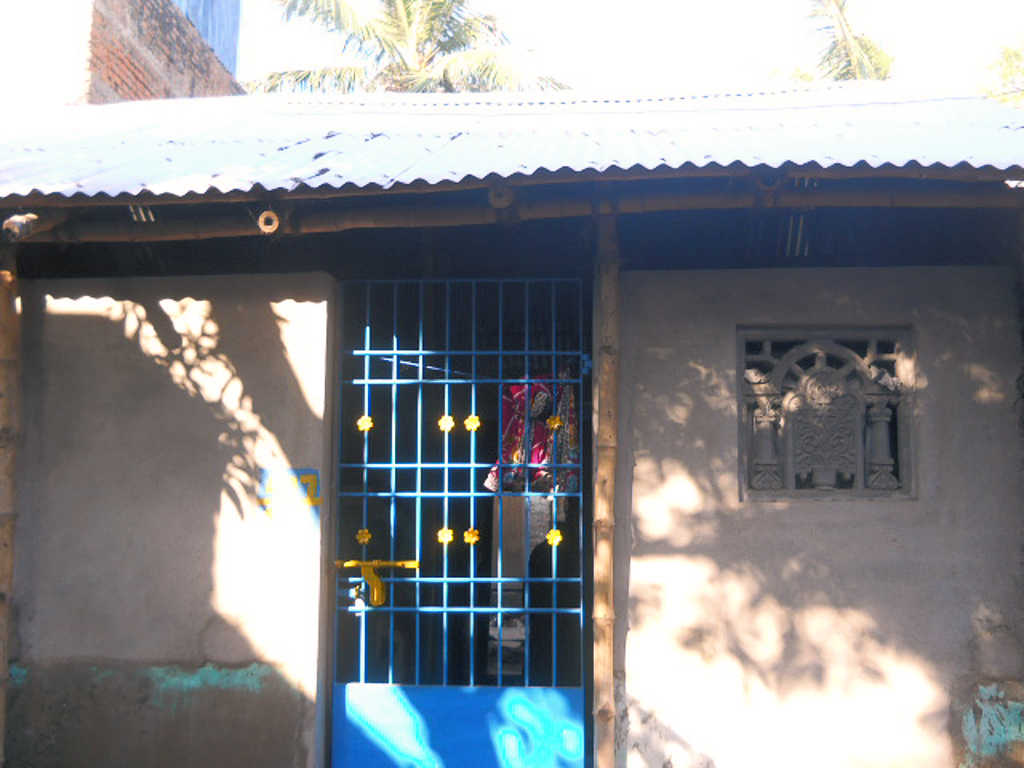
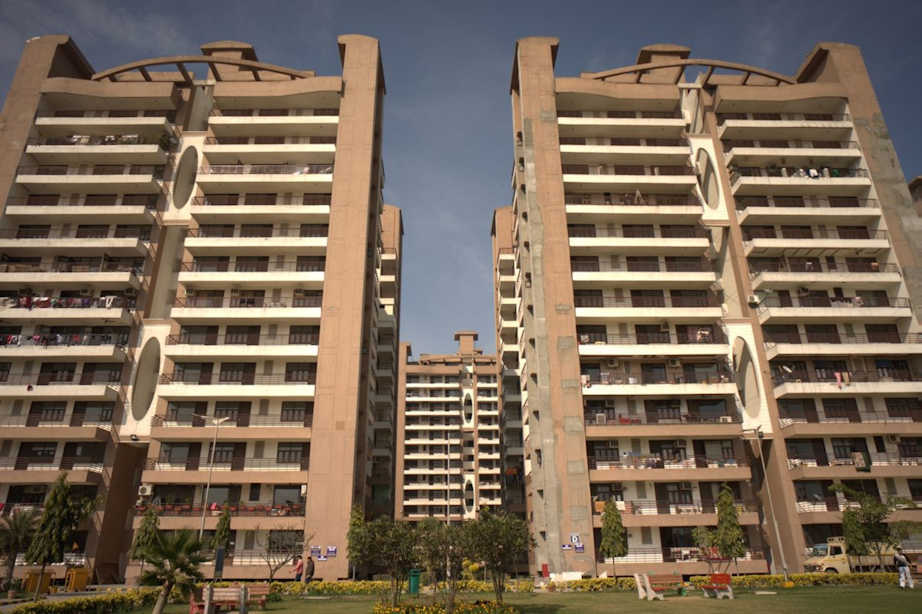
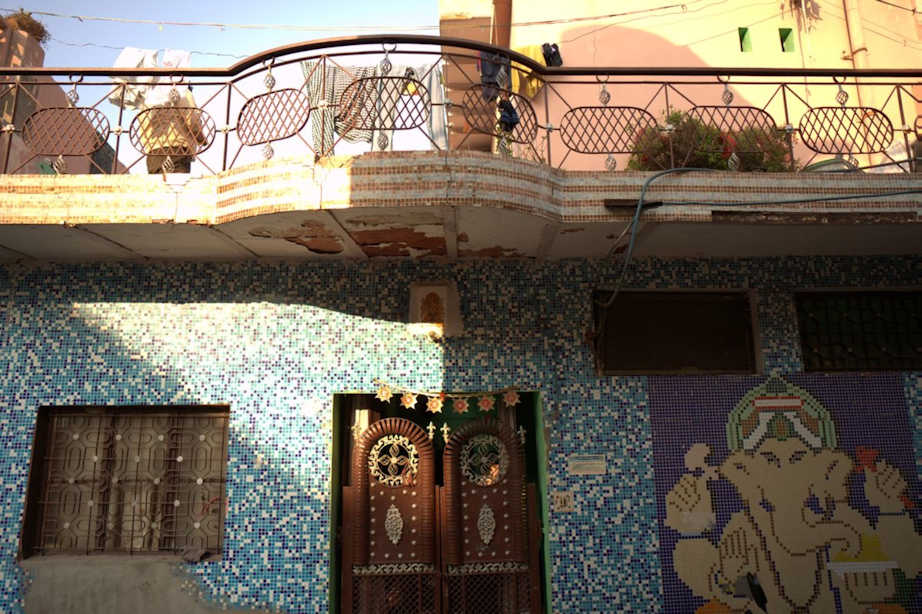
Wie vielfältig die Lebensbedingungen in einem einzigen Land sein können, zeigt folgende, bei weitem unvollständige Übersicht über Wohnen in Indien, jeweils preisbereinigtes Einkommen (PPP = purchasing power parity = Kaufkraftparität) pro Person :
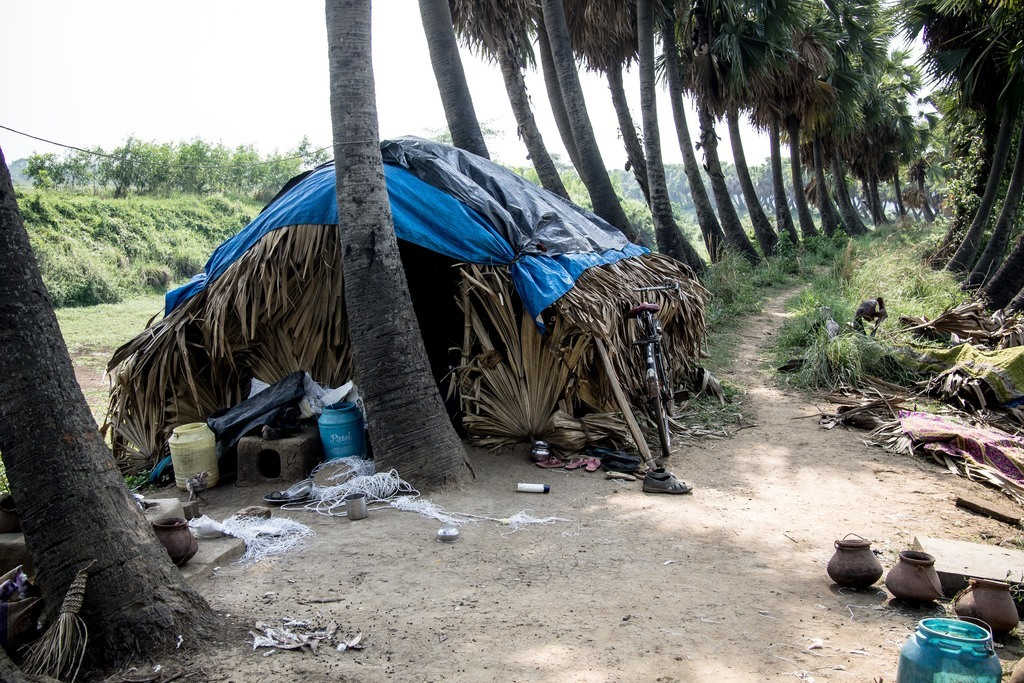
$29 PPP, West Bengal
Photo:
Zoriah Miller for Dollar Street
(CC BY 4.0)
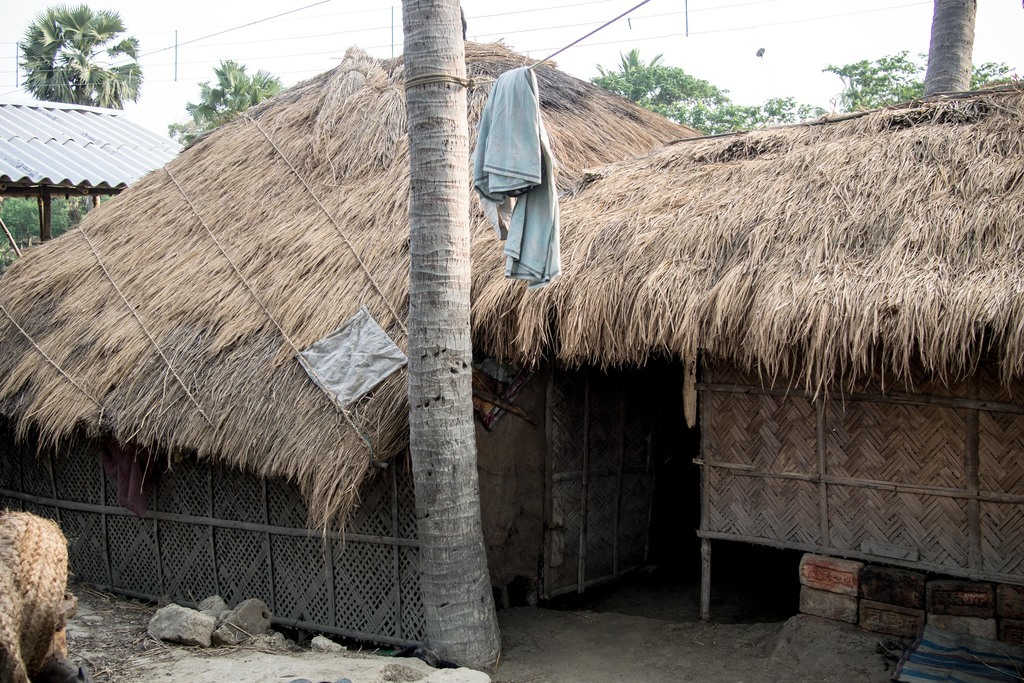
$31 PPP, Kolkata
Photo:
Zoriah Miller for Dollar Street
(CC BY 4.0)
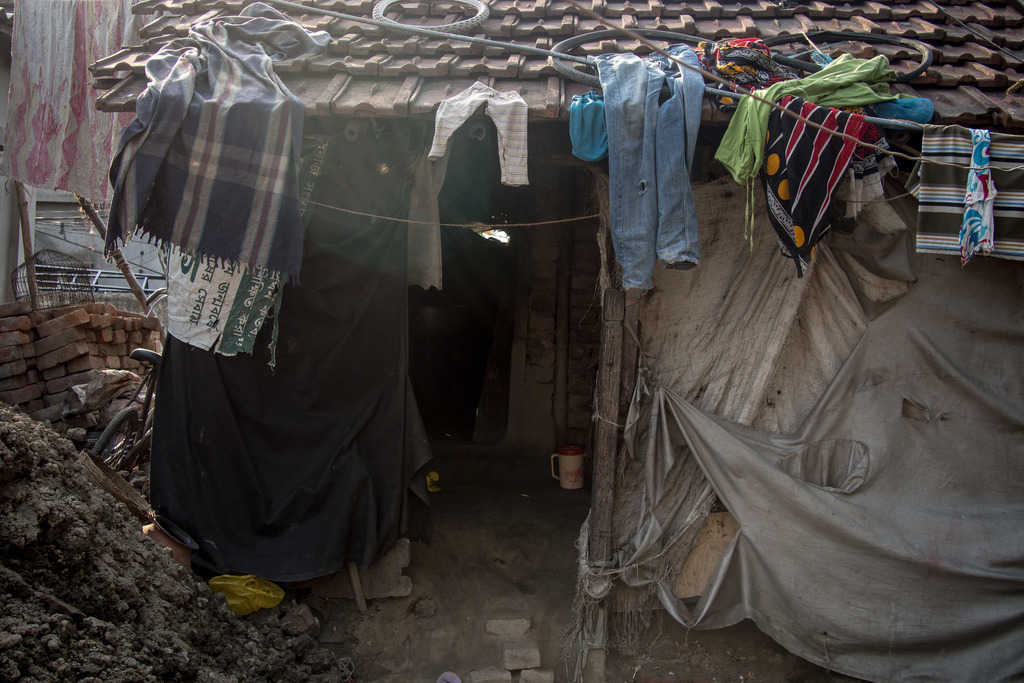
$48 PPP, Kolkata
Photo:
Zoriah Miller for Dollar Street
(CC BY 4.0)
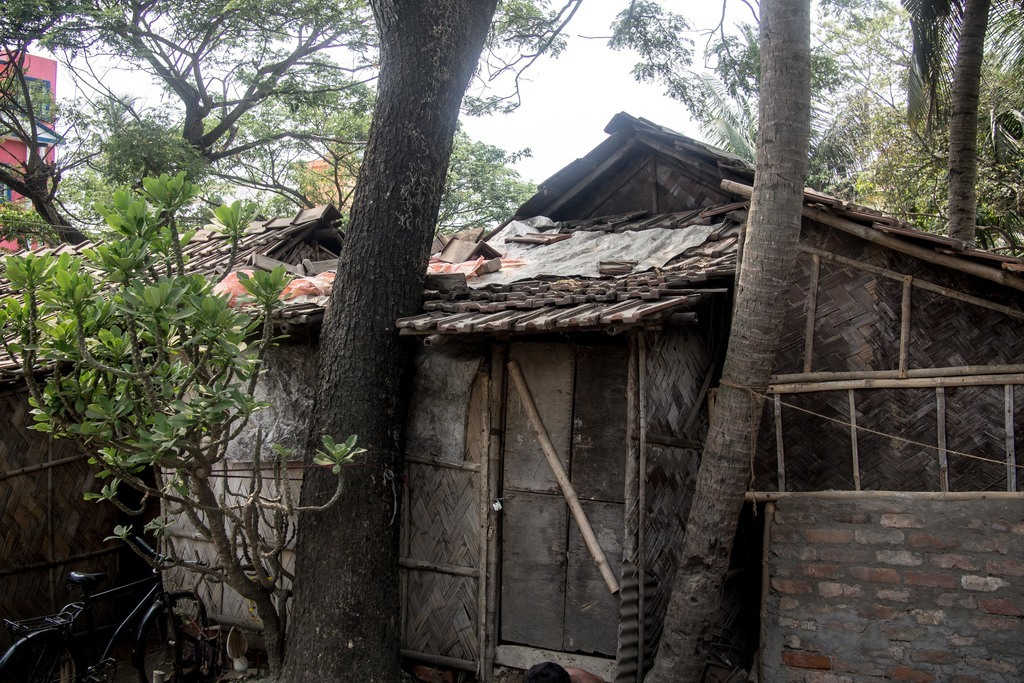
$65 PPP, West Bengal
Photo:
Zoriah Miller for Dollar Street
(CC BY 4.0)
$80 PPP, West Bengal
Photo:
Zoriah Miller for Dollar Street
(CC BY 4.0)
$135 PPP, bei Kolkata
Photo:
Zoriah Miller for Dollar Street
(CC BY 4.0)
$170 PPP, Kolkata
Photo:
Zoriah Miller for Dollar Street
(CC BY 4.0)
$221 PPP, Nayabadh
Photo:
Zoriah Miller for Dollar Street
(CC BY 4.0)
$245 PPP, Chennai
Photo:
AJ Sharma for Dollar Street
(CC BY 4.0)
$369 PPP, Gurgaon
Photo:
Zoriah Miller for Dollar Street
(CC BY 4.0)
$397 PPP, Chennai
Photo:
AJ Sharma for Dollar Street
(CC BY 4.0)
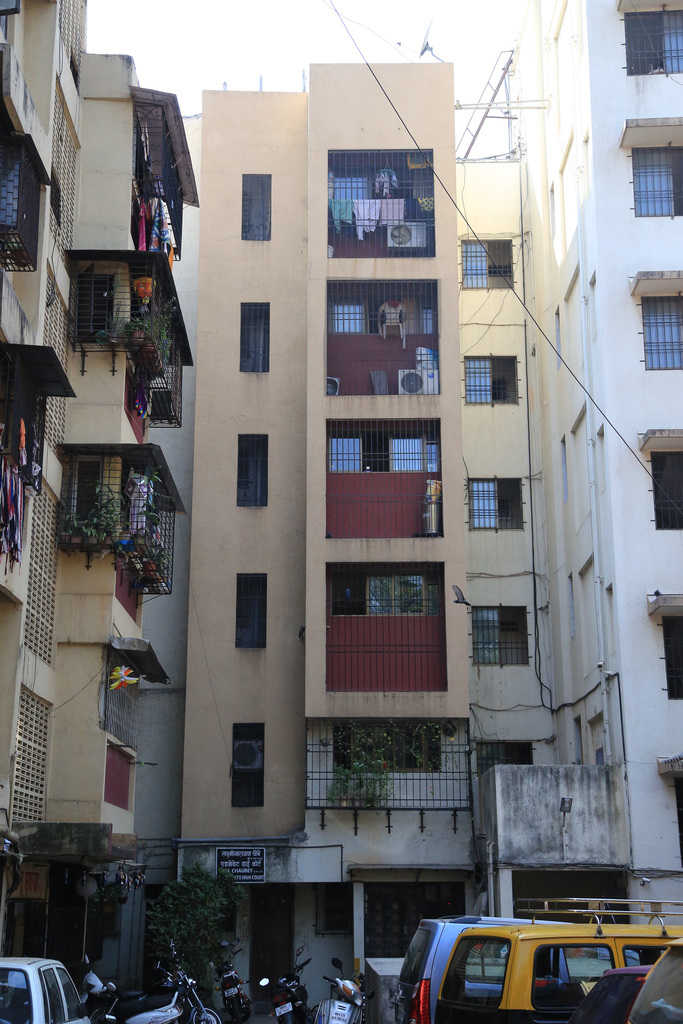
$466 PPP, Mumbai
Photo:
AJ Sharma for Dollar Street
(CC BY 4.0)
$963 PPP, Haryana
Photo:
Zoriah Miller for Dollar Street
(CC BY 4.0)
$1125 PPP, Delhi
Photo:
Zoriah Miller for Dollar Street
(CC BY 4.0)
$2499 PPP, Pune
Photo:
Agnisha Bose for Dollar Street
(CC BY 4.0)
Eine Fülle von Fotos (CC BY 4.0) zu verschiedensten Themen in weltweiter Vielfalt findet man auf
Dollar Street. -- https://www.gapminder.org/dollar-street/matrix. -- Zugriff am 2018-09-14
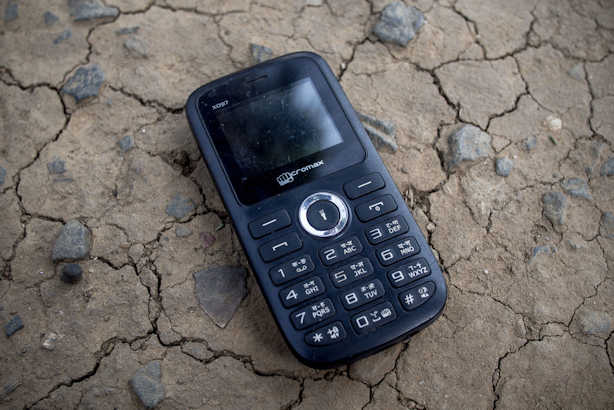
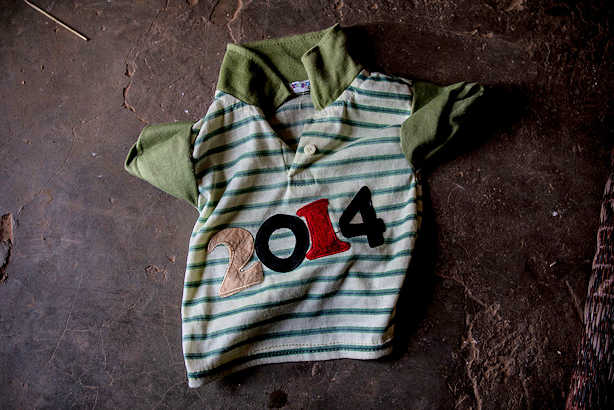
Beliebtester Gegenstand
PPP = purchasing power parity = Kaufkraftparität) pro Person
|
|
|
|
|
|
|
|
Weitere Bilder von beliebtesten Gegenständen: https://www.gapminder.org/dollar-street/matrix?thing=Most%20loved%20items. -- Zugriff am 2018-10-05
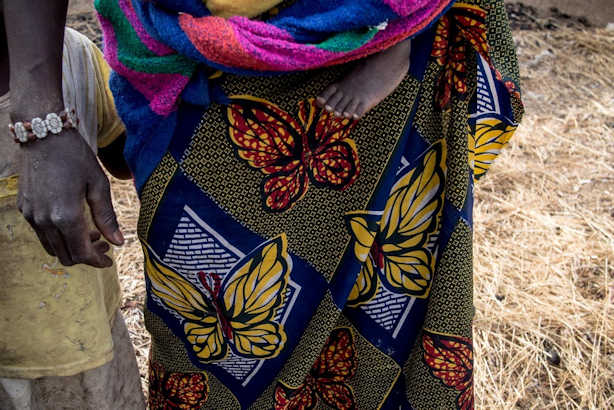
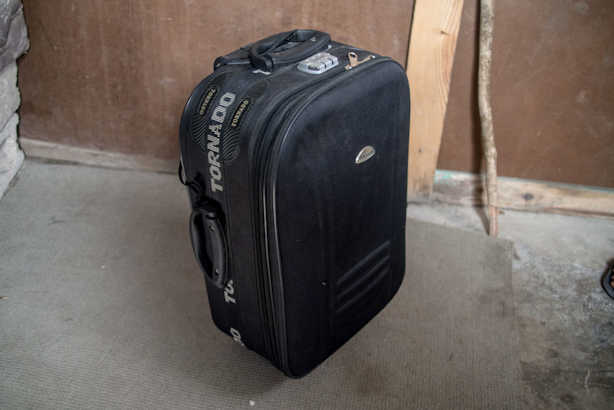
Nächster großer Gegenstand, den man anschaffen möchte
PPP = purchasing power parity = Kaufkraftparität) pro Person
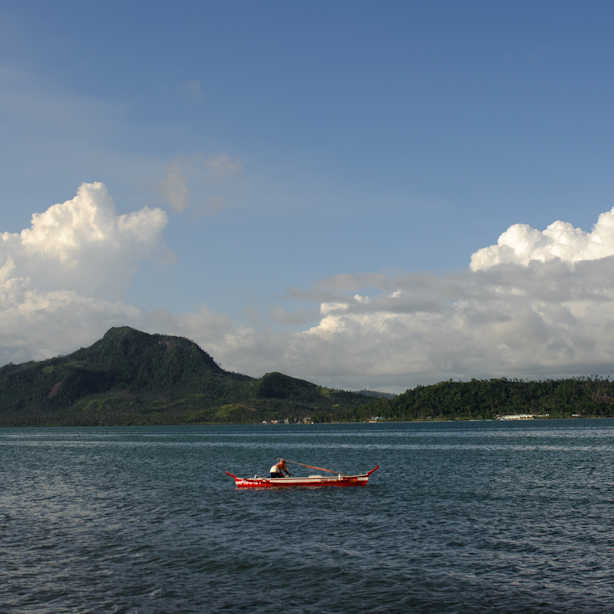 Philippinen, Südostasien, Monatseinkommen $93 PPP Photo: Luc Forsyth for Dollar Street (CC BY 4.0) |
 Myanmar, Südostasien, Monatseinkommen $93 PPP Photo: Luc Forsyth for Dollar Street (CC BY 4.0) |
 Ruanda, Ostafrika, Monatseinkommen $53 PPP Photo: Johan Eriksson for Dollar Street (CC BY 4.0) |
Weitere Bilder großer Anschaffungswünsche: https://www.gapminder.org/dollar-street/matrix?thing=Next%20big%20things%20I%20plan%20to%20buy. -- Zugriff am 2018-10-05
Rückblick
Vor 20 Jahren (1998) definierte man Entwicklungsländer folgendermaßen:
Dieter Nohlen [Lexikon Dritte Welt / hrsg. Dieter Nohlen. -- Vollständig überarbeitete Neuausgabe. -- Reinbeck : Rowohlt, ©1998. -- (rororo ; 16527). -- ISBN 3499606844. -- S. 222f. (s.v. Entwicklungsländer] unterscheidet zwei grundsätzliche Richtungen bei den Festlegungen von Definitionen von Entwicklungsländern:
Merkmalskataloge von Unterentwicklung, als Zustand /Stadium begriffen (vorwiegend endogene Faktoren):
Definitionen von Unterentwicklung, als Struktur begriffen (vorwiegend exogene Faktoren):
Entwicklungsländer sind "Länder, die in asymmetrischer, sie benachteiligender Weise in die internationale Arbeitsteilung eingebunden sind, deren Produktionsstrukturen auf den Weltmarkt und auf die Befriedigung der Bedürfnisse der Industrieländer ausgerichtet ist. Der Wirtschaftskreislauf von Entwicklungsländer-Ökonomie ist nicht geschlossen, es fehlen wichtige Sektoren (Konsumgütersektor, Investitionsgütersektor), oder diese sind nur schwach entwickelt. Wirtschaft und Gesellschaft der Entwicklungsländer sind strukturell heterogen." [Lexikon Dritte Welt / hrsg. Dieter Nohlen. -- Vollständig überarbeitete Neuausgabe. -- Reinbeck : Rowohlt, ©1998. -- (rororo ; 16527). -- ISBN 3499606844. -- S. 222f. (D. Nohlen)]
1977 veröffentlichte der Wirtschaftswissenschaftler Michael P. Todaro [Todaro, Michael P.: Economics for a developing world : an introduction to principles, problems and policies for development. -- London : Longman, 1977. -- 3. ed 1992] ein Modell von Unterentwicklung, das einen unvollständigen Eindruck der Vielschichtigkeit von Unterentwicklung gibt:
Quelle der Abbildung: Nuscheler, Franz <1938 - >: Lern-und Arbeitsbuch Entwicklungspolitik. -- 4., aktualisierte Aufl., 1. durchges. Nachdr. der 4. Aufl. -- Bonn : Dietz, 1996. -- ISBN 3-8012-0224-0. -- S. 153. -- {Wenn Sie HIER klicken, können Sie dieses Buch bei amazon.de bestellen}
Das United Nations Development Program (UNDP) (http://www.undp.org. -- Zugriff am 2018-09-14) veröffentlicht seit seit 1990 jährlich den Human Development Report (HDR)
Wikipedia: https://en.wikipedia.org/wiki/Human_Development_Report. -- Zugriff am 2018-09-14
Bisher sind erschienen:
Im Human Development Report wurde der Human Development Index (HDI) entwickelt.
Wikipedia:
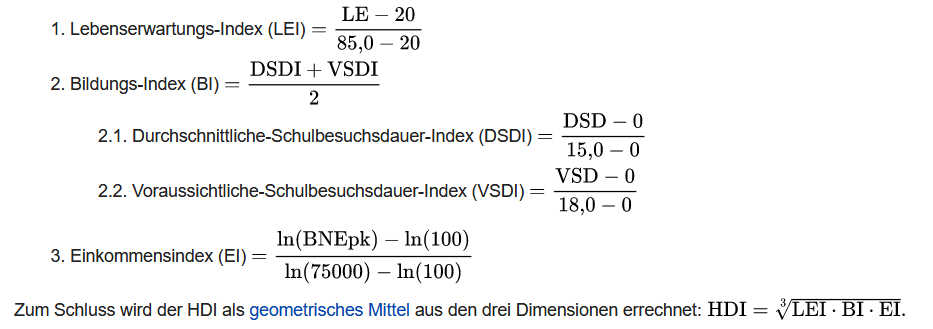
Seit 2010 wird der Human Development Index (HDI) auf folgende Weise berechnet:
"Ab dem Bericht über die menschliche Entwicklung 2010 werden die drei Dimensionen wie folgt berechnet:
- Lebenserwartungsindex: Lebenserwartung bei Geburt (LE)
- Bildungsindex: Durchschnittliche Schulbesuchsdauer (DSD) und voraussichtliche Schulbesuchsdauer (VSD) in Jahren
- Lebensstandard: Bruttonationaleinkommen (BNE) pro Kopf (BNEpk), KKP US$
LE: Lebenserwartung bei Geburt
DSD: Durchschnittliche Schulbesuchsdauer (Anzahl Jahre, die eine 25-jährige Person oder älter die Schule besucht hat)
VSD: Voraussichtliche Schulbesuchsdauer (Anzahl Jahre, die ein 5-jähriges Kind voraussichtlich zur Schule gehen wird)
BNEpk: Bruttonationaleinkommen pro Kopf kaufkraftbereinigt in US-DollarDie Minimal- und Maximal-Werte (Zielwerte) dienen zur Normalisierung der Teilindizes im Wertebereich [0;1]. Dazu wurden die Minimal- und Maximalwerte festgelegt. Für den Report 2014 gelten:
Indikator beobachtetes Maximum Minimum Lebenserwartung 85,0
(limitiert auf)20,0 Durchschnittliche Schulbesuchsdauer 15,0
(limitiert auf)0 Voraussichtliche Schulbesuchsdauer 18,0
(limitiert auf)0 BNE pro Kopf (KKP $) 75.000
(limitiert auf)100 Zur Unterscheidung von der ursprünglichen Methode wird der nach dieser Methode bestimmte Index teilweise auch New Human Development Index (NHDI) genannt."
[Quelle: https://de.wikipedia.org/wiki/Index_der_menschlichen_Entwicklung. -- Zugriff am 2018-09-14
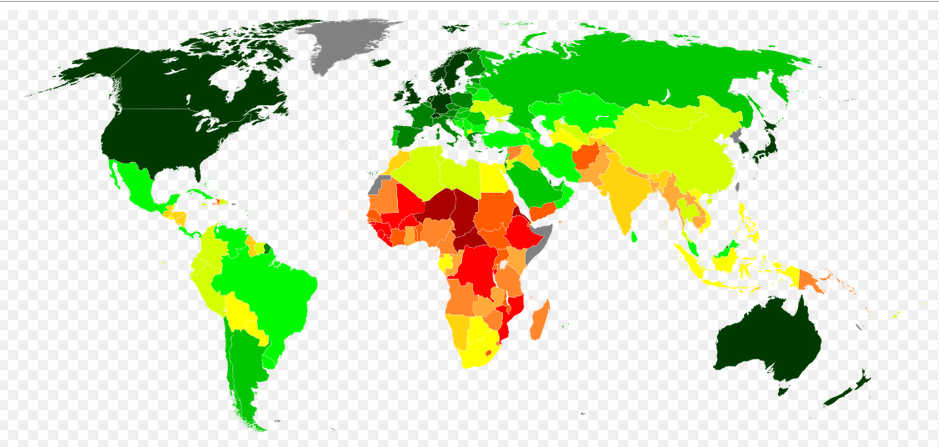
Höchster möglicher Wert: 1.000; Niedrigster möglicher Wert: 0.000
[Bildquelle:
https://commons.wikimedia.org/wiki/User_talk:Happenstance. --
CC BY-SA 4.0]
Der GDI misst die gleichen Komponenten mittels der gleichen Indikatoren wie der Human Development Index (HDI) aber aufgeschlüsselt nach Geschlecht. Der GDI ist also -- in Bezug gesetzt zum HDI -- ein Maß für die Benachteiligung von Frauen bzw. der Männer.
Wikipedia:
Das GEM misst die Partizipation von Frauen am politischen und wirtschaftlichen Leben.
Wikipedia:
Es werden folgende Indikatoren verwendet:
| Anteil der Frauen an den Parlamentsabgeordneten (seats in parliament held by women) (in %) |
| Frauenanteil in führenden Verwaltung- und Managementpositionen (female administrators and managers) (in %) |
| Frauenanteil unter den ausgebildeten Beschäftigten (female professional and technical workers) (in %) |
| Frauenanteil am Erwerbseinkommen (Maß für ungleiche Bezahlung) (women's share of earned income) (in %) |
Der Frauenbeteiligungsindex kann Werte zwischen 0 und 1 annehmen.
Seit 1978 veröffentlicht die Weltbank (The World Bank Group. -- https://www.worldbank.org/. -- Zugriff am 2018-09-14] jährlich den Weltentwicklungsbericht (World Development Report) mit jeweils unterschiedlichen Schwerpunktthemen und einem Tabellenanhang mit sozialen und ökonomischen Indikatoren.
Wikipedia:
Die Daten sind online zugänglich:
http://wdi.worldbank.org/tables. -- Zugriff am 2018-09-14
World Development Indicators 2017 als pdf:
https://openknowledge.worldbank.org/bitstream/handle/10986/26447/WDI-2017-web.pdf. -- Zugriff am 2018-09-14
Die Indikatoren (World Development Indicators) sind in folgendermaßen gruppiert:
"World Development Indicators includes data spanning up to 56 years—from 1960 to 2016. World view frames global trends with indicators on population, population density, urbanization, GNI, and GDP. As in previous years, the World view online tables present indicators measuring the world’s economy and progress toward improving lives, achieving sustainable development, providing support for vulnerable populations, and reducing gender disparities. Data on poverty and shared prosperity are now in a separate section, while highlights of progress toward the Sustainable Development Goals are now presented in the companion publication, Atlas of Sustainable Development Goals 2017.
The global highlights in this section draw on the six themes of World Development Indicators:
- Poverty and shared prosperity, which presents indicators that measure progress toward the World Bank Group’s twin goals of ending extreme poverty by 2030 and promoting shared prosperity in every country.
- People, which showcases indicators covering education, health, jobs, social protection, and gender and provides a portrait of societal progress across the world.
- Environment, which presents indicators on the use of natural resources, such as water and energy, and various measures of environmental degradation, including pollution, deforestation, and loss of habitat, all of which must be considered in shaping development strategies.
- Economy, which provides a window on the global economy through indicators that describe the economic activity of the more than 200 countries and territories that produce, trade, and consume the world’s output.
- States and markets, which encompasses indicators on private investment and performance, financial system development, quality and availability of infrastructure, and the role of the public sector in nurturing investment and growth.
- Global links, which presents indicators on the size and direction of the flows and links that enable economies to grow, including measures of trade, remittances, equity, and debt, as well as tourism and migration.
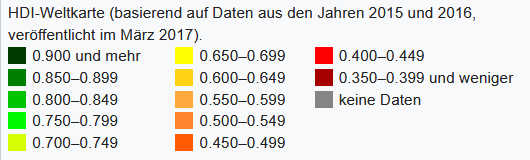
1. Poverty and shared prosperity
Poverty and shared prosperity presents indicators that measure progress toward the World Bank Group’s twin goals of ending extreme poverty by 2030 and promoting shared prosperity in every country in a sustainable manner. These two goals are closely linked to key themes of the Sustainable Development Goals: Goal 1 seeks to end poverty in all its forms everywhere, and Goal 10 focuses on reducing inequality within and across countries.
The first of the World Bank’s goals aims to reduce the share of people worldwide living below the international poverty line (currently $1.90 a day per person in 2011 purchasing power parity terms) to below 3 percent by 2030. The related Sustainable Development Goal target (1.1) is even more ambitious: It aims for all countries, regions, and groups within countries to achieve zero poverty at the same international poverty line.
The World Bank’s shared prosperity goal seeks to foster growth in the consumption or income of the poorest 40 percent of the population in each country—the bottom 40 percent. The related Sustainable Development Goal target (10.1) aims to progressively achieve and sustain income growth of the bottom 40 percent of the population at a rate higher than the national average by 2030. The target uses the notion of the shared prosperity premium—the difference between the growth in the consumption or income of the bottom 40 percent and the growth in the consumption or income of the mean—to measure progress (World Bank 2016). The basis for measuring both the World Bank and Sustainable Development Goal targets is the same: estimates of household consumption and income derived from more than 1,000 household surveys in 159 countries, available in PovcalNet (http://iresearch.worldbank.org/PovcalNet/), the World Bank’s online tool for monitoring global poverty. To ensure comparability across countries, indicators are measured using purchasing power parity exchange rates from the International Comparison Program, which adjust for price differences across countries.
The international poverty line provides a useful global benchmark, but many national governments use poverty measures that are more relevant to their national contexts. Countries define monetary poverty lines using either consumption or income, and national poverty lines typically reflect a threshold below which a person’s minimum nutrition, clothing, and shelter needs cannot be met, consistent with the country’s economic and social circumstances.
Alongside the incidence of poverty measured by national thresholds, countries may also focus on complementary measures that capture the depth and severity of poverty. Similarly, the consumption or income share of the bottom 40 percent is one of the many measures of the distribution of income within a country. Other inequality measures, such as the Gini index or the distribution of consumption or income by quintile, capture different aspects of the income distribution. The indicators in the World Development Indicators database and online tables present several such indicators related to poverty and inequality.
People presents indicators on education, health, jobs, social protection, and gender. These five themes account for a large part of the Sustainable Development Goals agenda—in particular, Goal 1 on poverty eradication, Goal 3 on health, Goal 4 on education opportunities, Goal 5 on gender equality, Goal 6 on water and sanitation, and Goal 8 on decent work and economic growth.
Data for indicators in People are collected and compiled by national authorities and by international development agencies, including the World Bank. The collaboration of thematic and statistical experts across these organizations helps ensure that the data are robust, reliable, and timely. For example, in response to concerns about different data sources and methodologies making global monitoring of child mortality difficult, the United Nations Inter-agency Group for Child Mortality Estimation began compiling all available data, assessing data quality, and generating modelled estimates, which has enhanced the reliability, transparency, and comparability of neonatal, infant, and under-five mortality rates. Similar initiatives have improved estimates of maternal mortality.
2. People
People includes several new indicators, added primarily to improve coverage of the Sustainable Development Goals. New health indicators help measure targets under Goal 3: incidence of malaria and incidence of HIV (target 3.3), mortality from noncommunicable diseases and suicide mortality rate (target 3.4), and alcohol consumption (target 3.5). Indicators for access to water and sanitation, which measure progress toward targets 6.1 and 6.2 under Goal 6, are now disaggregated by wealth quintile. A new indicator on education attainment of people ages 25 and older provides information on the skills and qualifications of a country’s adult population (target 4.4). Two new indicators—proportion of women subject to physical or sexual violence and women’s participation in decisionmaking—shed light on gender equality and are related to Goal 5 (targets 5.2 and 5.5).
National averages can mask differences among subgroups of a population, and the Sustainable Development Goals call for disaggregation of many indicators. Many indicators in People are disaggregated by sex, age, wealth quintile, and urban or rural location. Estimates of malnutrition, poverty, and population over time at the subnational level are now available online. The World Bank is also leading collaborative efforts to compile gender-disaggregated data on financial inclusion, employment law, and business regulations.
3. Environment
Environment includes more than 140 indicators related to the use of natural resources and changes in the natural and built environment. They encompass the availability and use of environmental resources (forest, water, cultivable land, and energy) and cover environmental degradation (pollution, deforestation, and loss of habitat and biodiversity). They also include aspects of the built environment such as agricultural infrastructure and urbanization.
These themes mirror aspects of many of the Sustainable Development Goals: Goal 2 promotes sustainable agriculture, Goal 6 considers availability of and access to water, Goal 7 covers reliable energy, Goal 11 tackles the challenges that urbanization creates, Goal 12 focuses on the consumption and the sustainable management of the earth’s resources, Goal 13 demands action on climate change, Goal 14 seeks conservation of the oceans and marine life, and Goal 15 covers protection of natural habitats and biodiversity and land restoration efforts. The Environment indicators illuminate many of these issues.
The growth of the population, acceleration of urbanization, and expansion of economies place demands on the Earth’s resources. The degradation of soil, the increasing scarcity of freshwater, the overexploitation of coastal ecosystems and fisheries, the loss of forest cover, the expansion of pollution, and the loss of biological diversity undermine efforts to reduce poverty and promote sustainable economic growth. Climate change is already affecting every country. Its manifestations include rising temperatures, changing precipitations patterns, rising sea levels, and more extreme weather events, all of which pose risks to agriculture, water supplies, food production, ecosystems, energy security, and infrastructure.
Estimates of the Environment indicators have been drawn from international sources and have been standardized as much as possible to facilitate cross-country comparisons. But ecosystems span national boundaries, and access to natural resources may vary within countries. For example, water may be abundant in some parts of a country but scarce in others, and countries often share water resources. Greenhouse gas emissions and climate change are measured globally, but their effects are experienced locally. Measuring environmental phenomena and their effects at the subnational, national, and supranational levels remains a major challenge.
The data on energy access include two major improvements. First, collaboration among the World Bank, the International Energy Agency, and the Energy Sector Management Assistance Program has resulted in estimates of the proportion of the total, rural, and urban population with access to electricity (Sustainable Development Goal target 7.1) back to 1990. Second, collaboration between the World Bank and the World Health Organization has led to a new indicator: proportion of population with access to clean fuels and technologies for cooking (Sustainable Development Goal target 7.2). The new indicator refines a previous indicator on access to nonsolid fuels, which included some nonclean fuels.
4. Economy
Economy provides a window to the global economy and the economic activity of the more than 200 countries and territories that produce, trade, and consume the world’s output. The indicators in the World Development Indicators database monitor changes in the size and structure of the global economy and their effects on national economies. Indicators include measures of macroeconomic performance (GDP, consumption, investment, international trade, balance of payments, central government budgets, prices, and money supply). Broader measures of income and savings, adjusted for pollution, depreciation, and depletion of resources, are also available.
Many of these indicators are used to monitor the targets of the Sustainable Development Goals. For example, the indicator on annual GDP growth relates to target 8.1, which aims for at least 7 percent GDP growth a year in the least developed countries. The indicator on natural resource rents as a share of GNI compared with adjusted net savings as a share of GNI measures how well countries are using resources to invest in other kinds of capital. This captures important aspects of target 12.2, which encourages the efficient use and sustainable management of natural resources.
Countries revise their national accounts estimates periodically to incorporate new data sources, improved methodologies, or new standards and classifications or to update the base year for growth estimates. This ongoing process improves data quality and international comparability.
Such revisions to national accounts and GDP data cause discontinuities, or breaks, in the series unless they are applied carefully and consistently to historical data. To present consistent time series for GDP growth, the World Development Indicators database has always included adjusted constant price series, by linking old series to the new using historical growth rates. However, the current price series were not adjusted (that is, they remained unlinked), which caused artificial jumps in the derived implicit GDP deflator and inflation series. To mitigate this problem, this year’s Economy indicators include additional linked series for current price GDP, the implicit GDP deflator, and inflation. To extrapolate the implicit deflator, the methodology uses historical inflation rates, as published by national sources. Consistent time series for linked current price GDP are then derived using the constant price GDP and the implicit GDP deflator. The new series are published in the World Development Indicators database with the following codes: GDP, linked series (NY.GDP.MKTP.CN.AD); GDP deflator, linked series (NY.GDP.DEFL.ZS.AD); and inflation, GDP deflator, linked series (NY.GDP.DEFL.ZG.AD). Data are available for 1990–2015.
5. States and markets
States and markets presents indicators on private investment and performance, the public sector’s role in nurturing investment and growth, and the quality and availability of infrastructure essential for growth. These indicators measure the business environment, government functions, financial system development, infrastructure, information and communication technology, science and technology, government and policy performance, and conditions in fragile countries with weak institutions.
Many of these topics are part of the Sustainable Development Goals: Goal 9 focuses on infrastructure, industrialization, and innovation; Goal 16 promotes peace, justice, and strong institutions; and Goal 17 promotes partnerships for global development. Indicators that relate to these goals include passenger and freight volumes (target 9.1), research and development expenditure as a proportion of GDP and researchers per million inhabitants (target 9.5), fixed Internet broadband subscriptions (target 17.6), individuals using the Internet (target 17.8), and the proportion of businesses that encountered requests for bribes and informal payments from officials (target 16.5).
New in States and markets is an indicator on industrial design applications, which complements existing patent and trademark indicators. An industrial design right protects only the appearance or aesthetic features of a product, whereas a patent protects an invention that offers a new technical solution to a problem. Together, these industrial property indicators capture trends in policy, business, and technology through all dimensions of the inventive process (geographical location, technical and institutional origin, individuals, and networks). In 2015 nearly 3 million patent applications, 6 million trademark applications, and 873,000 industrial design applications were filed globally.
To measure filing activity for industrial designs, States and markets uses the application design count—that is, the number of designs in the applications instead of the number of applications. Design count is a better way of comparing filing activity across intellectual property offices because at some locations users can register multiple designs through a single application. Similarly, trademark data by class count are now presented in the World Development Indicator database from 2004 onwards. Previously, the indicator used trademarks applications, but depending on a country’s legal system, one or more classes can be specified in a trademark application, with the intent to obtain protection of the mark across different goods and services. The data for patent, trademark, and industrial design applications are also available by applicant type (resident and nonresident).
6. Global links
Global links presents an overview of the flows and associations that enable the world’s economy, and those of individual countries, to grow and expand. Indicators measure the size and direction of trade in goods and services, of aid and other financial flows, and of the movements of people, as well as the impact of policy interventions. These data also help illuminate Sustainable Development Goal 17, which aims to strengthen the Global Partnership for Sustainable Development.
The volume of world trade rose 2.7 percent in 2015, roughly in line with GDP growth, but the sharp drop in oil and other commodity prices and exchange rate volatility caused the value of global merchandise trade to fall 14 percent, to $16 trillion. Demand for imports slowed in Asia and resource-based economies but strengthened in the United States and the European Union. Low- and middle-income countries’ share of merchandise exports continued to rise, to 42 percent in 2015, up from 33 percent in 2005.International financial flows to low- and middle-income countries recorded an outflow ($184 billion) for the first time since the 2008 global financial crisis—driven primarily by a contraction in short-term debt, which swung from a net inflow of $130 billion in 2014 to a 2015 outflow of $398 billion. Long-term debt flows fell by half, to $214 billion. Despite reduced bond issuance, bonds still constituted more than half of long-term debt flows in 2015.
Global foreign direct investment inflows rebounded, with an increase of 20 percent in 2015—due primarily to a 35 percent increase in flows to high-income economies. A large part of this growth was from corporate reconfigurations, whose transactions often involve large movements in the balance of payments but little change in actual operations. High-income countries were the destination for 70 percent of global foreign direct investment ($1.5 trillion) in 2015. China, Brazil, and India together account for over half of all foreign direct investment inflows to low- and middle-income countries, which overall declined 4 percent in 2015, reflecting a contraction in intercompany lending.
Growth in international remittances, in the form of personal transfers and compensation of employees, slowed sharply in 2015. They rose only 0.4 percent, to $552 billion, due to weak economic growth in Europe, the deterioration of the Russian economy, and the depreciation of the euro and ruble. Over three-quarters of global remittances ($421 billion) went to low- and middle-income countries in 2015, where they play an important role in financing the economy. The number of international migrants continued to grow, exceeding 250 million in 2015.
Quelle: http://wdi.worldbank.org/tables. -- Zugriff am 2018-09-14. -- CC BY 3.0 IGO
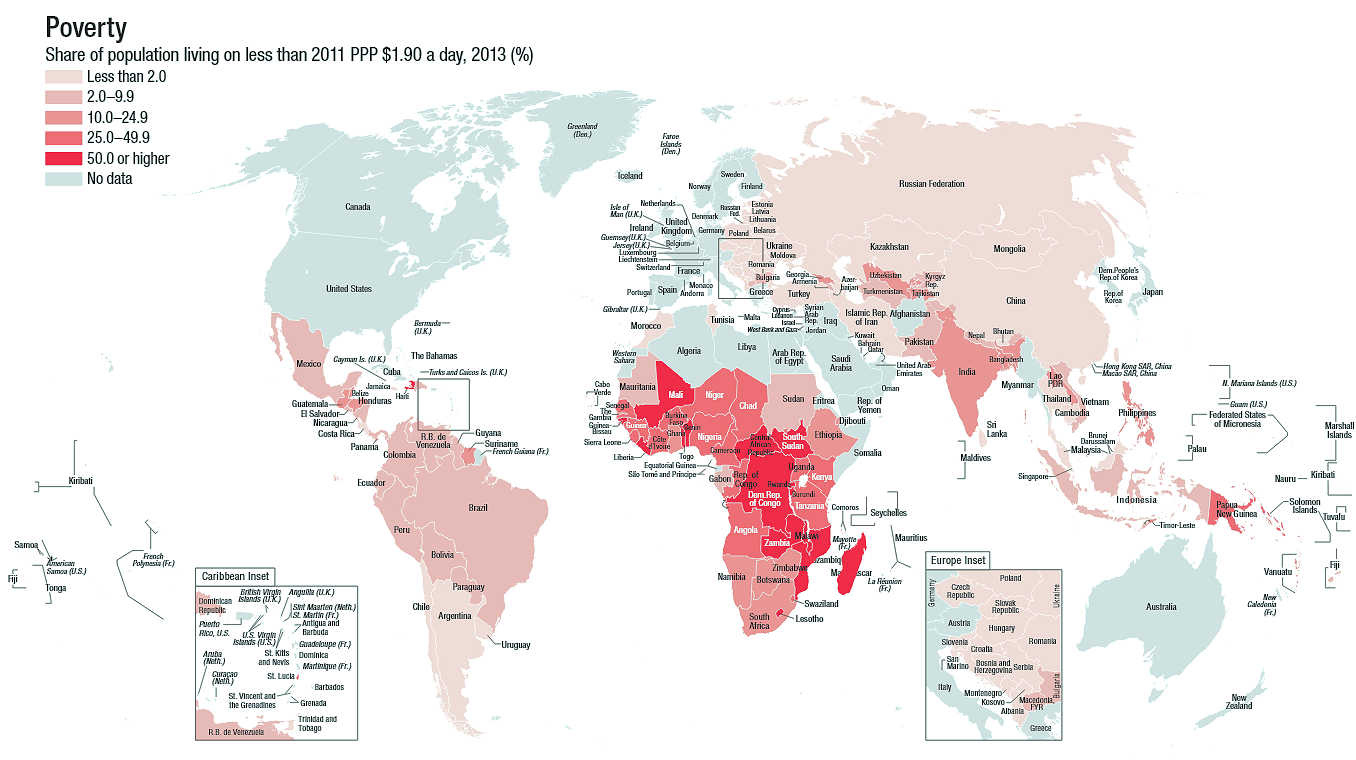
Abb.: Prozentsatz der Personen, die mit weniger als $1.90 pro Tag auskommen
müssen, 2011
[Bildquelle: Weltbank. --
http://databank.worldbank.org/data/download/site-content/wdi/maps/2017/maps-wdi-2017-sec-1-poverty.pdf.
-- Zugriff am 2018-09-14. --
CC BY 3.0 IGO]
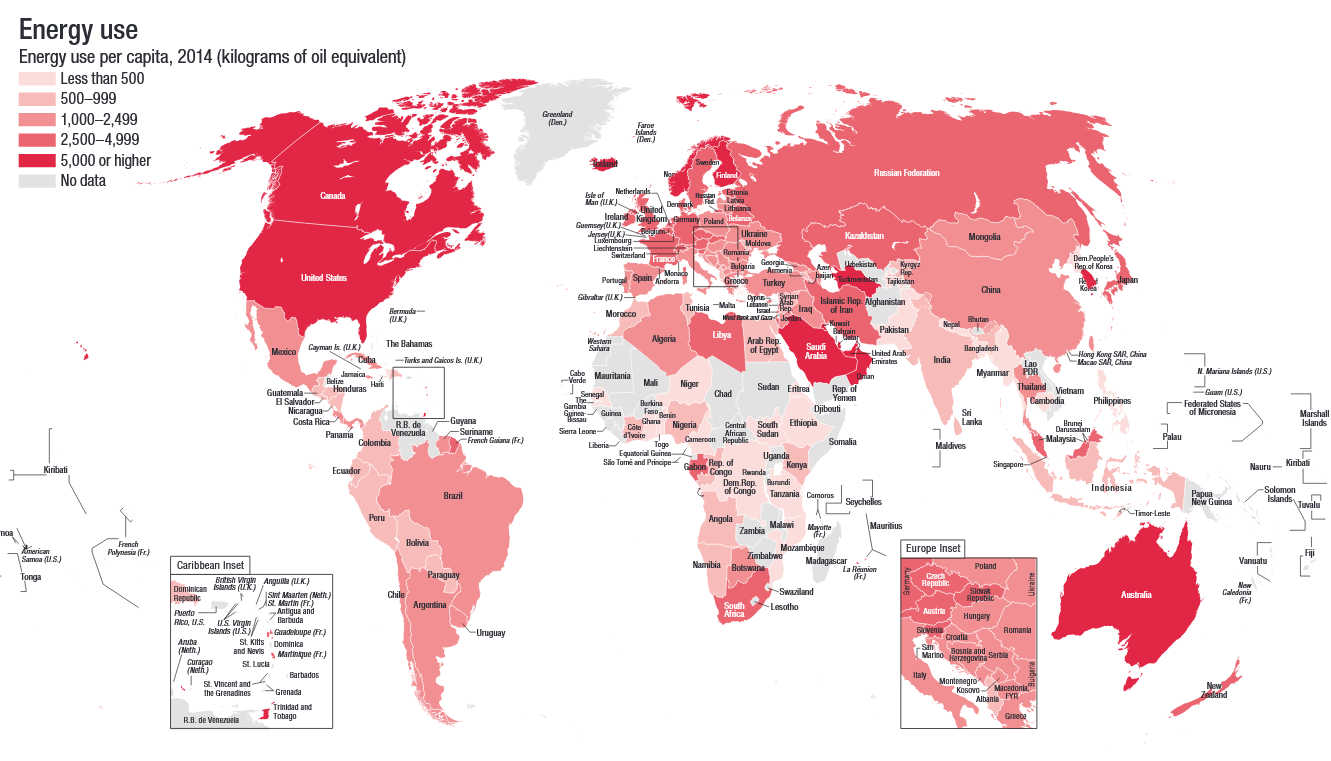
Abb.: Energieverbrauch pro Person in Kilogramm Öl oder Äquivalentem, 2014
[Bildquelle: Weltbank. --
http://databank.worldbank.org/data/download/site-content/wdi/maps/2017/maps-wdi-2017-sec-3-energy-use.pdf.
-- Zugriff am 2018-09-14. --
CC BY 3.0 IGO]
Die UNO-Generalversammlung beschloss 1971 die Kategorie LLDCs - Least Developed Countries.
2018 umfasst die Liste der LLDCs folgende Länder:
|
LEAST DEVELOPED COUNTRIES
Africa (33)
|
|||
|
1
|
Angola
|
18
|
Malawi # |
|
2
|
Benin
|
19
|
Mali # |
|
3
|
Burkina Faso #
|
20
|
Mauritania |
|
4
|
Burundi #
|
21
|
Mozambique |
|
5
|
Central African Republic #
|
22
|
Niger # |
|
6
|
Chad #
|
23
|
Rwanda # |
|
7
|
Comoros *
|
24
|
São Tomé and Príncipe * |
|
8
|
Democratic Republic of the Congo
|
25
|
Senegal |
|
9
|
Djibouti
|
26
|
Sierra Leone |
|
10
|
Eritrea |
27
|
Somalia |
|
11
|
Ethiopia # |
28
|
South Sudan # |
|
12
|
Gambia |
29
|
Sudan |
|
13
|
Guinea |
30
|
Togo |
|
14
|
Guinea-Bissau * |
31
|
Uganda # |
|
15
|
Lesotho # |
32
|
United Republic of Tanzania |
|
16
|
Liberia |
33
|
Zambia # |
|
17
|
Madagascar |
|
|
|
Asia Pacific (13)
|
|||
|
1
|
Afghanistan #
|
8
|
Nepal #
|
|
2
|
Bangladesh
|
9
|
Solomon Islands *
|
|
3
|
Bhutan #
|
10
|
Timor-Leste *
|
|
4
|
Cambodia
|
11
|
Tuvalu *
|
|
5
|
Kiribati *
|
12
|
Vanuatu *
|
|
6
|
Lao People’s Democratic Republic #
|
13
|
Yemen
|
|
7
|
Myanmar
|
||
|
Latin America and the Caribbean
(1)
|
|||
|
1
|
Haiti *
|
||
* Also a Small Island Developing State# Also a Landlocked Developing Country
[Quelle: http://unohrlls.org/about-ldcs/. -- Zugriff am 2018-09-14]
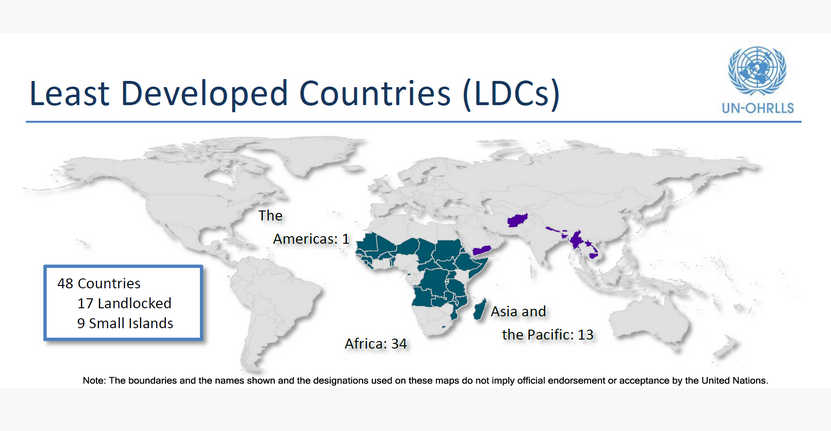
Abb.: LLDCs - Least Developed Countries
[Bildquelle:
http://unohrlls.org/about-ldcs/facts-and-figures-2/. -- Zugriff am
2018-09-14. -- Fair use]
Die Folgende Einführung in Entwicklungsländerstudien ist gegliedert in
1. Grundgegebenheiten, z.B.
2. Kernprobleme, z.B.
3. Entwicklungsstrategien
4. Entwicklungspolitik und Entwicklungshilfe, z.B.
5. Ausgewählte Problemfelder der Entwicklung, z.B.
Lexikon Dritte Welt / hrsg. Dieter Nohlen. -- Vollständig überarbeitete Neuausgabe. -- Reinbeck : Rowohlt, ©1998. -- (rororo ; 16527). -- 869 S. -- ISBN 3499606844. -- [sehr empfehlenswert].
Wikipedia:
Zu Kapitel 2: Grundgegebenheiten: Klima und Wetter