mailto: payer@hdm-stuttgart.de
Zitierweise / cite as:
Mahanama <6. Jhdt n. Chr.>: Mahavamsa : die große Chronik Sri Lankas / übersetzt und erläutert von Alois Payer. -- 0. Einleitung -- 4. Landeskunde Sri Lankas. -- 3. The economy / von John D. Rogers. -- Fassung vom 2006-06-29. -- URL: http://www.payer.de/mahavamsa/chronik0043.htm. -- [Stichwort].
Hauptquelle (diese ist als solche zu zitieren!):
Sri Lanka : a country study / Federal Research Division, Library of Congress ; edited by Russell R. Ross and Andrea Matles Savada. -- 2nd ed. -- Washington, D.C. : The Division, 1990. -- XXXIII, 322 S. : Ill. ; 24 cm. -- Rev. ed. of: Area handbook for Sri Lanka / Richard F. Nyrop ... [et al.]. 1970. -- "Research completed October 1988." -- Online: http://lcweb2.loc.gov/frd/cs/lktoc.html. -- Zugriff am 2006-06-23]
Erstmals publiziert: 2006-06-29
Überarbeitungen:
Anlass: Lehrveranstaltungen, Sommersemester 2001, 2006
©opyright: Public Domain
Dieser Text ist Teil der Abteilung Buddhismus von Tüpfli's Global Village Library
3. Chapter 3 - The Economy (John D. Rogers)
THE DOMINANT SECTOR of the Sri Lankan economy historically has been wet rice (paddy) cultivation. Its importance in ancient times is demonstrated by the extensive irrigation works constructed in the north-central region of the island in the first millennium A.D. In the thirteenth century, the civilization based on these reservoirs began to decline, and population shifted to the wet zone of the southern and southwestern areas, where irrigation was less necessary to grow rice. Cinnamon and other spices which were valuable in the European market became important export commodities in the sixteenth century, when Europeans, first the Portuguese and then the Dutch, established control over the coastal areas of the island.
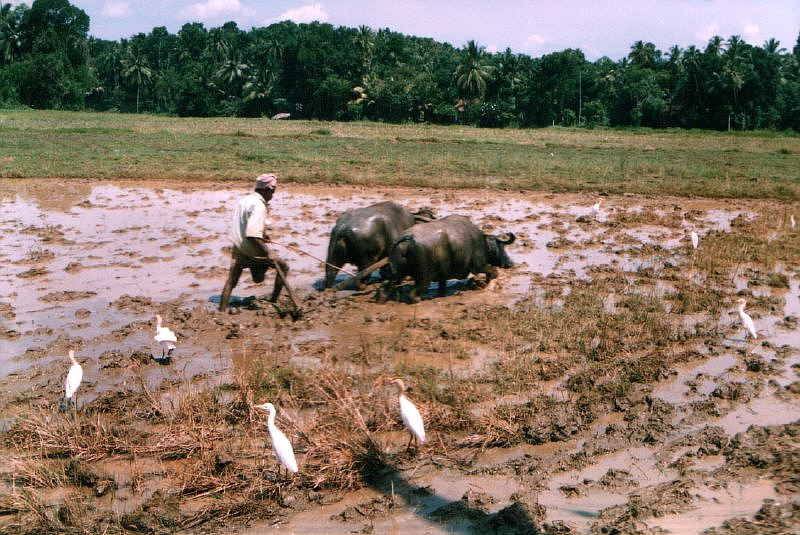
Abb.: Pflügen eines Reisfelds mit Wasserbüffeln, 2005
[Bildquelle: Reign. --
http://www.flickr.com/photos/reign/66267194/. -- Creative Commons Lizenz
(Namensnennung, keine kommerzielle Nutzung). -- Zugriff am 2006-06-25]
Commercial agriculture came to dominate the economy during the British period (1796-1948). Extensive coffee plantations were established in the mid-nineteenth century. Coffee failed when a leaf disease ravaged it in the 1870s and 1880s, but it was quickly replaced by the important commercial crops of tea, rubber, and coconut. Although wet rice cultivation remained important, Sri Lanka had to import more than one-half of the rice it needed during the late nineteenth and early twentieth centuries because of the land and labor devoted to the commercial crops. At independence in 1948, almost all of the islands' foreign exchange earnings were derived from commercial agriculture.
The fundamental economic problem since the 1950s has been the declining terms of trade. The proceeds from the traditional agricultural exports of tea, rubber, and coconut have had less and less value in the international marketplace. Beginning in the early 1960s, governments responded by intervening directly in the largely free-market economy inherited from the colonial period. Imports and exports were tightly regulated, and the state sector was expanded, especially in manufacturing and transportation. This trend accelerated between 1970 and 1977, when a coalition headed by the Sri Lanka Freedom Party nationalized the larger plantations and imposed direct controls over internal trade.
The United National Party (UNP) contested the 1977 general election with a platform calling for less regulation of the economy. After its electoral victory, the new UNP government made some effort to dismantle the state sector in agriculture and manufacturing. At the same time, it encouraged private enterprise, welcomed foreign investment and slackened import controls. It also shifted spending away from subsidies and social welfare to investment in the nation's infrastructure, most notably a massive irrigation project, the Mahaweli Ganga Program, which was expected to make Sri Lanka self-sufficient in rice and generate enough hydroelectric power to fill the nation's requirements. These policies resulted in higher rates of economic growth in the late 1970s and early 1980s, but at the cost of a mounting external debt. Foreign aid from the United States, Western Europe, Japan, and international organizations kept the economy afloat.
Sri Lanka's economy became more diverse in the 1970s and 1980s, and in 1986 textiles surpassed tea for the first time as the country's single largest export. Nonetheless, the performance of the traditional agricultural exports remained essential to the country's economic health. Other important sources of foreign exchange included remittances from Sri Lankans working overseas, foreign aid, and tourism.
| Economy of Sri Lanka | ||
|---|---|---|
| Currency | Sri Lankan rupee (LKR) | |
| Fiscal year | Calendar Year | |
| Trade organisations | SAFTA, WTO | |
| Statistics | ||
| GDP ranking | 60th (2004) | |
| GDP | $80.58 billion (2004) | |
| GDP growth | 5.2% (2004) | |
| GDP per capita | $4,000 (2004) | |
| GDP by sector | agriculture (19.1%), industry (26.2%), services (54.7%) (2004) | |
| Inflation | 5.8% (2004) | |
| Pop below poverty line | 22% (1997) | |
| Labour force | 7.26 million (1996) | |
| Labour force by occupation | agriculture (38%), industry (17%), services (45%) (1998) | |
| Unemployment | 7.8% (2004) | |
| Main industries | rubber processing, tea, coconuts, and other agricultural commodities. telecommunications, insurance, banking, clothing, cement, petroleum refining, textiles, tobacco | |
| Trading Partners | ||
| Exports | $5.306 billion (2004) | |
| Export - Commodities | textiles and apparel, tea and spices, diamonds, emeralds, rubies, coconut products, rubber manufactures, fish | |
| Main partners | United States 31%, United Kingdom 12.9%, India 5.1%, Belgium 4.9%, Germany 4.9% (2004) | |
| Imports | $7.265 billion (2004) | |
| Imports - Commodities | textile fabrics, mineral products, petroleum, foodstuffs, machinery and transportation equipment | |
| Main Partners | India 14%, Singapore 8%, China 7.6%, Hong Kong 5.9%, Malaysia 4.6%, Japan 4.6% (2004) | |
| Public finances | ||
| Public debt | 104.3% of GDP (2004) | |
| Revenues | $3.34 billion (2004) | |
| Expenses | $4.686 billion (2004) | |
| Economic aid | $577 million (recipient)(1998) | |
[Quelle der Tabelle: http://en.wikipedia.org/wiki/Economy_of_Sri_Lanka. -- Zugriff am 2006-06-26]
"With an economy of $80.58 billion, and a per capita GDP of about $4,000, Sri Lanka has mostly enjoyed strong growth rates in recent years. Sri Lanka began to shift away from a socialist orientation in 1977. Since then, the government has been deregulating, privatizing, and opening the economy to international competition. Twenty years of civil war has no doubt slowed economic diversification and liberalization, and the leftist Janatha Vimukthi Peramuna (JVP) uprisings, especially the second in the late 1980s, also caused extensive upheavals and economic uncertainty. Following the quelling of the JVP, increased privatization, reform, and a stress on export-oriented growth helped revive the economy's performance, taking GDP growth to 7% in 1993. Economic growth has been uneven in the ensuing years as the economy faced a multitude of global and domestic economic and political challenges. Overall, average annual GDP growth was 5.2% over 1991-2000. In 2001, however, GDP growth was negative 1.4%--the first contraction since independence. The economy was hit by a series of global and domestic economic problems and affected by terrorist attacks in Sri Lanka and the United States. The crises exposed the fundamental policy failures and structural imbalances in the economy and the need for bold reforms. The year ended in parliamentary elections in December, which saw the election of a more pro-capitalism party to Parliament (the Sri Lanka Freedom Party retains the Presidency).
The government of Prime Minister Ranil Wickremasinghe of the United National Party has indicated a strong commitment to economic and social sector reforms, deregulation, and private sector development. In 2002, Sri Lanka commenced a gradual recovery. Early signs of a peace dividend were visible throughout the economy--Sri Lanka has been able to reduce defense expenditures and begin to focus on getting its large, public sector debt under control. In addition, the economy has benefited from lower interest rates, a recovery in domestic demand, increased tourist arrivals, a revival of the stock exchange, and increased foreign direct investment (FDI). In 2002, economic growth bounced up to 4%, helped by strong service sector growth. Agriculture staged a partial recovery. Industrial sector growth, however, faltered for the second consecutive year due to weak demand and lower prices for Sri Lanka's exports. The government was able to exert fiscal control, and inflation trended down. Total FDI inflows during 2002 were about $246 million and are expected to exceed $300 million in 2003. The largest share of FDI has been in the services sector. Good progress was made under the Stand By Arrangement, which was resumed by the International Monetary Fund (IMF). These measures, together with peaceful conditions in the country, have helped restore investor confidence and created conditions for the government to embark on extensive economic and fiscal reforms and seek donor support for a poverty reduction and growth strategy.
Foreign exchange reserves, which fell by 11% in 1999, decreased further in 2000. In response, the government floated the rupee on January 23, 2001. This led to a significant nominal depreciation in 2001, but the rupee has since stabilized and reserves have gradually been replenished.
The year 2003 is poised to be another eventful year for Sri Lanka. Continued peace has allowed further progress on macroeconomic stabilization during the first half of the year. Economic growth has picked up to 5.5% in the first quarter, from 0.5% in the comparable period in 2002. This growth was largely driven by the services sector (particularly telecom and tourism), and the industrial sector posted modest growth. Both exports and imports have risen 13% in the first 4 months. Interest rates are declining. The inflation rate hovers around 9%. External reserves were sufficient to cover 5.1 months of imports. The Colombo Stock Exchange has rebounded to become one of the better performers in the area. The CSE rose 45% in 2002 and hit a record high in June 2003 as business confidence continued to expand. Fortunately, the SARS epidemic did not spread to Sri Lanka, and tourism was not severely affected. Sri Lanka's garment exporters reported a surge in orders, shifted from China due to SARS. On the negative side, in mid-2003 Sri Lanka experienced its worst floods in 50 years, which caused extensive damage in south and southwestern parts of the country. The government is relying on donor funding to reconstruct the flood-damaged areas, avoiding recourse to government finances. The adverse impact from floods on overall growth for 2003 is estimated to be marginal.
Economic recovery is expected to consolidate during the rest of 2003, and GDP growth for the year is predicted at 5.5%, increasing to 6.5% in 2004. All major sectors of the economy are expected to expand. This growth will, however, depend on the continuation of the peace process, policy adjustments (particularly budgetary control), and structural reforms. Recovery in the global economy also is important as well as effective aid utilization. According to the Finance Minister, the fiscal deficit is forecast to decline to 7.5% of GDP in 2003, with the government instituting more controls on fiscal management. Given Sri Lanka's high debt burden (105% of GDP), fiscal consolidation is central to budget planning and macroeconomic programming. Stagnant government revenue, however, remains a big worry in 2003.
The future of Sri Lanka's economic health is uncertain but largely dependent on the continuation of the peace process, political stability, and continued policy reforms--particularly in the area of fiscal discipline and direct management. Implementation of major reforms in the civil service and education sectors and more disciplined spending and improved revenue collection would help generate stronger economic growth. If privatization continues and export orientation strengthens, weaknesses in government will have less impact on growth. Real growth is expected to continue in the 4%-6% range beyond 2003 but may remain below the 8%-9% growth needed to move quickly into the status of a middle-income or newly developed country.
Other challenges include diversification from Sri Lanka's key exports--tea and garments. Garment exports will face increased competition in a quota-free era when the Multi Fiber Arrangement expires in 2005. The future of the tea industry is threatened by a shortage of plantation labor and growing competition. There are new efforts to diversify exports, explore tourism potential, and improve competitiveness. The government has an ambitious information and communications technology strategy to connect and service every corner of the country. This project, if implemented successfully, could change Sri Lanka's economy and social fabric and would take it into the information age. The government hopes to take advantage of Sri Lanka's strategic location on shipping routes, make use of the Indo-Lanka Free Trade Agreement, and sign free trade agreements with other countries to achieve regional trading hub status. If peace returns and all these efforts bear fruit, real growth could be in the 6%-7% range beyond 2004, and will help realize the government's intention of making Sri Lanka the gateway to South Asia.
The service sector is the largest component of GDP (54%). In 2003, the service sector continued its strong expansion, fueled primarily by strong growth in telecom and financial services. Public administration and defense expenditures have remained steady. Repatriated earnings of Sri Lankans working abroad continued to be strong. Tourism continues to be a significant contributor to this sector as well, although it has not reached full potential due to continued worries about the conflict. There also is a small but growing information technology sector, especially information technology training and software development and exports.
Manufacturing accounts for about 15.9% of GDP. The textile, apparel, and leather products sector is the largest, accounting for 44% of total industrial output. The second largest industrial sector, at 24% of total manufacturing output, is food, beverages, and tobacco (this sector grew by 4.6% in 2002). The third-largest industrial sector is chemical, petroleum, rubber, and plastic products--16% of output, with 5.7% growth in 2002.
Agriculture has lost its relative importance to the Sri Lankan economy in recent decades. It accounts for 20.1% of GDP and provides employment to 33% of the working population. Rice, the staple cereal, is cultivated extensively. The plantation sector consists of tea, rubber, and coconut; in recent years, the tea crop has made significant contributions to export earnings and saw production increases of about 5% in 2002. Tea prices have continued to decline due to record world tea output in recent years. The construction sector accounts for 7.4% of GDP and mining and quarrying 1.8%. In recent years, the government has eliminated many price controls and quotas, reduced tariff levels, eliminated most foreign exchange controls, and sold more than 55 state-owned companies and 20 estate-holding companies. Colombo boasts one of the most modern stock exchanges in the region, and the Sri Lankan Government offers a range of tax and other incentives to attract potential investors."
[Quelle: http://en.wikipedia.org/wiki/Economy_of_Sri_Lanka. -- Zugriff am 2006-06-26]
Villagers and cart in rural Sri Lanka, circa 1910
Courtesy Library of Congress
Sri Lanka's economic prospects in early 1988 were linked at least in part to the political and security situation. If political violence could be brought under control, the government had commitments from foreign investors and donors to finance a reconstruction program that would ensure economic growth in the short term. If the violence were to continue, the diversion of resources into defense and the negative impact on tourism and foreign investment appeared likely to result in economic stagnation.
Agriculture, both subsistence and commercial, has played a dominant role in Sri Lanka's economy for many centuries. The Portuguese and Dutch, who ruled the coastal regions of the island from the sixteenth through the eighteenth centuries, were primarily interested in profiting from cinnamon and other spices (see European Encroachment and Dominance, 1500-1948; The Dutch , ch. 1). Trade with India, Sri Lanka's nearest neighbor, was also important during this period. Sri Lanka exported pearls, areca nuts, shells, elephants, and coconuts, and in return received rice and textiles.
The island's economy began to assume its modern form in the 1830s and 1840s, when coffee plantations were established in the Central Highlands. Coffee soon became the dominant force in the economy, its proceeds paying for increasingly large imports of food, especially rice. When coffee fell victim to a leaf disease in the 1870s, it was quickly replaced by tea, which soon covered more land than had coffee at its height. Coconut plantations also expanded rapidly in the late nineteenth century, followed by rubber, another cash crop introduced in the 1890s. Stimulated by demand generated by the development of the automobile industry in Western Europe and North America, rubber soon passed coconuts in importance. These three products--tea, coconuts, and rubber-- provided the export earnings that enabled Sri Lanka to import food, textiles, and other consumer goods in the first half of the twentieth century. At independence in 1948, they generated over 90 percent of export proceeds.
Wet rice was grown extensively as a subsistence crop throughout the colonial period. In the nineteenth century, most of it was consumed in the villages where it was grown, but in the final decades of British rule the internal market in rice expanded. Nonetheless, more than half of the rice consumed was imported, and the island depended on the proceeds of plantation crops for its food supply.
The economy gradually became more diverse after the late 1950s, partly as a result of government policies that encouraged this trend. The main reason successive administrations tried to reduce the country's dependence on tea, rubber, and coconuts was the long-term decline in their value relative to the cost of imports. Even when Sri Lanka increased the production of its major cash crops, the amount of imports that could be bought with their proceeds declined.
Much of the diversification of the economy, especially in the 1960s and the early 1970s, took the form of import substitution, producing for the local market goods that the island could no longer afford to import. Sri Lanka also had some success in diversifying exports after 1970. The proportion of exports linked to the three traditional cash crops fell from over 90 percent in the late 1960s to 71 percent in 1974 and 42 percent in 1986. Textiles, which made up only 0.7 percent of exports in 1974, accounted for over 28 percent in 1986 (see table 5, Appendix A).
In 1986 agriculture, forestry, and fishing made up 27.7 percent of the gross national product (GNP--see Glossary), down from 39.4 percent in 1975 (see table 6, Appendix A). In 1956 wholesale and retail trade accounted for 19.9 percent of GNP, and manufacturing for 15.6 percent. Transport, storage, and communications stood at 11.2 percent of GNP, and construction at 7.7 percent. The relative importance of the various sectors of the economy was fairly stable during the 1980s.
The role of government in the economy during the final decades of British colonial rule was considerable. The plantation economy required extensive infrastructure; the colonial state developed and owned railroad, electrical, postal, telegraphic, telephone, and water supply services. Quasi-state financial institutions served the colony's commercial needs, and during World War II the government set up production units for plywood, quinine, drugs, leather, coir, paper, ceramics, acetic acid, glass, and steel. Welfare policies also began during colonial rule, including a network for free and subsidized rice and flour established in 1942. Free education, relief for the poor, and subsidized medical care were introduced in the late British period. Moreover, after 1935 the government took an active role in the planning and subsidizing of colonization schemes. This policy was designed to remove landless peasants from heavily populated areas to newly irrigated tracts in the dry zone.
Economic policy since Independence is divided into two periods. During the first, which lasted from 1948 to 1977, government intervention was often seen as the solution to economic problems. The expansion of government participation in the economy was fairly steady, resulting in a tightly regulated system. This trend was especially marked during the period of S.R.D. Bandaranaike's second government, from 1970 to 1977, when the state came to dominate international trade and payments; the plantation, financial, and industrial manufacturing sectors; and the major trade unions outside the plantation sector. It also played a major role in the domestic wholesale and retail trade.
The trend toward greater government involvement was largely a response to the deteriorating terms of trade. The plantation economy had financed social programs such as subsidized food in the late colonial period, but when the value of exports declined after 1957, the economy's capacity to support these programs was strained. When the foreign exchange reserves of the early 1950s dwindled, import-substituting industrialization was seen as a solution. Because the private sector viewed industrial development as risky, the government took up the slack. When balance of payment deficits became chronic, some nationalizations were justified by the need to stem the drain of foreign exchange. Similar concerns led to the tighter regulation of private business and the establishment of state-owned trading corporations. When there were shortages of necessities, governments expanded state control over their distribution in order to make them available at low prices.
The 1977 elections were largely a referendum on the perceived failures of the closed economy. The UNP, which supported a deregulated, open economy, won decisively. The new government rejected the economic policies that had evolved over the previous twenty years. Some observers believed that the economy had been shackled by excessive regulation, an excess of consumption expenditure over investment, and wasteful state enterprises. Under the UNP, market forces were to play a greater role in allocating resources, and state enterprises were to compete with the private sector (see The United National Party Returns to Power , ch. 1).
The main elements of the new policy were investment incentives for foreign and domestic capital, a shift in the composition of public spending from subsidies to infrastructure investment, and a liberalized international trade policy designed to encourage export-led growth. Employment creation was a central objective, both through encouragement of domestic and foreign capital investment, and through an ambitious public works program, including the Accelerated Mahaweli Program, which aimed to bring new land under irrigation and substantially increase hydroelectric generating capacity (see Government Policies , this ch.). Two other policies that sought to create employment were the establishment of investment promotion zones (free trade zones) and extensive government investment in housing.
The role of government during the decade after 1977 remained significant; the public investment program, for instance, was implemented on a greater scale than anything attempted previously, and in early 1988 the state remained heavily involved in many areas of economic activity. But while the government increased its efforts to develop the nation's infrastructure, it reduced its role in regulation, commerce, and production. Its initiatives received the enthusiastic support of the international development community. As a result, Sri Lanka received generous amounts of foreign aid to finance its post-1977 development program. This foreign assistance was integral to the government's economic strategy. Because budget deficits were large even before 1977, external financial resources were necessary to pay for the increased spending on infrastructure and to make up for the revenue lost as a result of the tax incentives given business. Similarly, relaxing import controls put pressure on the balance of payments, which could be relieved only with the help of foreign aid.
During the early years of independence, successive governments placed little emphasis on development planning, in part because the immediate economic problems appeared to be manageable. The National Planning Council was established in 1956 as part of the Ministry of Finance. Between 1957 and 1959, the council and the Central Bank of Sri Lanka invited a number of foreign economists to visit Sri Lanka and offer the government both their diagnoses of the country's economic problems and their prescriptions for the planning and implementation of recommended remedies. These studies provided many of the rationales for economic policies and planning in the 1960s.
In 1959 the National Planning Council issued a Ten-Year Plan, the most ambitious analysis of the economy and projection of planning that had yet been officially published. This plan sought to increase the role of industry in the economy. Unfortunately, its forecasts were based on faulty projections of population and labor force growth rates. Moreover, attempts to implement it collided with the exchange and price crunch of 1961 and 1962, and the plan became increasingly out of touch with the changing economic situation.
A new Ministry of Planning and Economic Affairs (no longer in existence) was established in 1965. The ministry decided not to draft another single long-term plan involving a five- or ten-year period. Instead, it drew up a number of separate, detailed, well-integrated, five-year plans involving different ministries. The government targeted agriculture, especially wet rice, as the area in which growth could best be achieved.
The UNP government that came to power in 1970 shifted toward a more formal and comprehensive state direction of the economy. The Five-Year Plan for 1972-76 had two principal aspects. First, it sought to remove disparities in incomes and living standards. Second, the plan sought to promote economic growth and to reduce unemployment. It envisioned rapid growth in agriculture, not only in the traditional crops of wet rice, tea, rubber, and coconut, but in such minor crops as sunflower, manioc, cotton, cashew, pineapple, and cocoa. Like the Ten-Year Plan of 1959, this plan proved to be based on overly optimistic assumptions, and it soon ceased to exercise influence on the government's economic policy. In 1975 it was replaced by a Two-Year Plan that placed even greater emphasis on agricultural growth and less on industrial development.
After 1977 the government continued to accept the principle of state direction of economic activity, but in contrast to the 1970-77 period the government encouraged the private sector to participate in the economy. Its first Five-Year Plan (1978-83) included an ambitious public investment program to be financed largely by overseas grants and loans. Its immediate objective was to reduce unemployment, which had risen during the tenure of the previous government.
A series of five-year rolling investment plans was set in motion by the Ministry of Finance and Planning in the 1980s. The plan for the 1986-90 period envisaged investment of Rs268 billion (for value of the rupee--see Glossary) with the emphasis on infrastructure projects such as roads, irrigation, ports, airports, telecommunications, and plantations. Of this total, 50 percent was to be spent by the state sector. Foreign sources were to supply Rs69 billion. The target annual average growth for the gross domestic product (GDP--see Glossary) was 4.5 percent, a decrease from the 5.2 percent envisaged by the plan for the 1985-89 period and the 6 percent actually achieved between 1977 and 1984.
Growth in GDP was estimated at 3 percent in 1987, down from 4.3 percent in 1986, and the lowest level in a decade (see table 7, Appendix A). By 1987 it was clear that the ongoing civil unrest was causing serious economic difficulties, mainly because rapidly increasing defense outlays forced the government to cut back capital expenditure and to run a large budgetary deficit. Concern over the decline in foreign investment and extensive damage to infrastructure mounted as sectors such as tourism, transportation, and wet rice farming suffered production losses directly related to the decline in security.
By early 1988, the ethnic conflict had resulted in extensive property damage. Infrastructure damage in Northern and Eastern provinces was estimated at Rs7.5 billion in August 1987 and was expected to be revised upwards to include the widespread destruction in the Jaffna Peninsula (see fig. 1). In the predominantly Sinhalese areas, riots against the 1987 Indo-Sri Lankan Accord caused damage to government property estimated at Rs4.8 billion (see Foreign Relations , ch. 4).
In early 1988, future economic prospects were closely linked to the security situation (see Primary Threats to National Security , ch. 5). Late the previous year, the government succeeded in obtaining commitments from foreign nations and international organizations to finance an extensive reconstruction program for the 1988-90 period (see Foreign Aid , this ch.). If there were a pronounced ebb in the political violence plaguing the island nation, it would be probable that the official target of Rs80 billion foreign aid over this three-year period would be reached. Aid on this scale, which would be a substantial increase on the already generous levels received, would not only enable the rebuilding of infrastructure destroyed by the violence but also fuel growth and allow the large trade and budget deficits to continue. Accordingly, the 1988 budget foresaw a sharp decline in defense spending and an increase in capital expenditure. These economic plans, however, depended on a peaceful solution to the country's political problems. If political violence escalated in subsequent years, not only would the government have to shift its spending back to defense, but some of the expected foreign aid probably would be suspended.
Figure 7. Accelerated Mahaweli Program, 1988
Source: Based on information from Asoka Bandarage, "Women and Capitalist Development in Sri Lanka, 1977-87," Bulletin of Concerned Asian Scholars, 20, April-June 1988, 58; and (Democratic Socialist Republic of) Sri Lanka, Mahaweli Authority of Sri Lanka, Mahaweli Saga, Challenge and Response, Colombo, 1985, 55.
Agriculture--including forestry and fishing--accounted for over 46 percent of exports, over 40 percent of the labor force, and around 28 percent of the GNP in 1986. The dominant crops were paddy, tea, rubber, and coconut. In the late 1980s, the government-sponsored Accelerated Mahaweli Program irrigation project opened a large amount of new land for paddy cultivation in the dry zone of the eastern part of the island (see fig. 7). In contrast, the amount of land devoted to tea, coconut, and rubber remained stable in the forty years after independence. Land reforms implemented in the 1970s affected mainly these three crops. Little land was distributed to small farmers; instead it was assumed by various government agencies. As a result, most tea and a substantial proportion of rubber production was placed under direct state control.
Since the beginning of the twentieth century, agriculture has been dominated by the four principal crops: rice, tea, rubber, and coconut. Most tea and rubber were exported, whereas almost all rice was for internal use. The coconut crop was sold on both domestic and international markets. The importance of other crops increased in the 1970s and 1980s, but no single crop emerged to challenge the four traditional mainstays.
Tea, rubber, and to a lesser extent, coconut are grown on plantations established in the nineteenth and early twentieth centuries. Before the plantations existed, villagers carried out three main types of cultivation. The valley bottoms and lowlands were occupied by rice paddies. These paddies were surrounded by a belt of residential gardens permanently cultivated with fruit trees and vegetables. The gardens in turn were surrounded by forests, parts of which were temporarily cleared for slash-and- burn cultivation, known as chena (see Glossary). Various grains and vegetables were grown on chena lands. The forests were also used for hunting, grazing for village cattle, gathering wild fruit, and timber. In some villages, especially in the dry zone, there was little rice cultivation, and people depended on the gardens and forests for their livelihood (see Land Use and Settlement Patterns , ch. 2).
Under legislation passed in 1840, the title of most forestland was vested in the government. In order to stimulate the production of export crops, the colonial administration sold large tracts to persons who wished to develop plantations. At first most buyers were British, but by the end of the nineteenth century many middle-class Sri Lankans had also acquired crown land and converted it to plantation use. The early coffee and tea plantations were often situated at high elevations, some distance from the nearest Sinhalese villages, but as time went on more estates were developed on land contiguous to villages. The precise impact of the plantations on village society remains controversial, but it is widely believed in Sri Lanka that the standard of living of villagers suffered as they lost use of the forestland.
Although the large coffee, tea, and rubber plantations relied mainly on Tamil migrants from southern India for their permanent labor supply, Sinhalese villagers were employed in the initial clearing of the forests, and some performed casual daily labor on the plantations in seasons when there was little work in the villages. The coconut plantations, being spatially closer to villages, employed considerable Sinhalese labor.
By the early twentieth century, there was no longer much land suitable for the expansion of cultivation in the wet zone, and in the 1930s the focus of agricultural development shifted from the wet zone to the dry zone and from plantation crops to rice. There was ample uncultivated land in the dry zone of the north-central region, but three major obstacles had to be overcome--the prevalence of malaria, the lack of a reliable supply of water to carry out rice cultivation, and the absence of farmers to cultivate the soil. The first of these problems was solved by the success of the antimalarial campaigns of the 1940s. The others were tackled by government policies that sought to restore and build irrigation works and resettle peasants from the wet zone in the newly irrigated areas. In the 1980s, the pace of this program was quickened by the Accelerated Mahaweli Program (see Government Policies , this ch.).
The most important change in agriculture in the forty years after independence was the increase in rice production. This increase resulted from better yields and the enlarged amount of land under cultivation. In contrast, with the exception of rubber in the 1950s and 1960s, the principal export crops showed only modest gains in productivity, and the amount of land devoted to tea and rubber fell. After around 1970, there was growth in the production of other crops, including onions, chilies, sugar, soybeans, cinnamon, cardamom, pepper, cloves, and nutmeg.
Fishing, a traditional industry in coastal waters, accounted for 2.1 percent of GNP in 1986. Government efforts to offer incentives for modernization had little impact. The civil disturbances of the 1980s badly affected the industry. Before 1983 the northern region produced nearly 25 percent of the fish catch and around 55 percent of cured fish, but in the mid-1980s fishing was not possible there for long periods. The value of the fish catch off the northern coast fell from Rs495 million in 1981 to Rs52 million in 1986. Production off the southern and western coasts and from inland fisheries grew during this period, but not enough to prevent a decline in the island's total catch. In 1987 the government announced plans to provide funds for investment in fishing in the North and East, but implementation was likely to depend on improved security in these areas.
Although there have been periodic agricultural censuses, they were limited in purpose and did not provide an overall picture of land use. In 1961, however, a survey of the use of the island's physical resources was compiled based on a 1956 aerial photographic survey of the entire country. The survey indicated that, of the country's total area of nearly 66 million hectares, 29 percent was under permanent cultivation, just over 15 percent under chena cultivation, 44 percent under forest cover, and about 6 percent under various types of grasses. Nearly 33,000 hectares consisted of swamp and marshlands, and about 63,000 hectares, or 1 percent, unused land. Just over 3 percent of the island's surface was covered by water. Of the total area, approximately 23 percent was in the wet zone, about 63 percent in the dry zone, and the balance lay in an area that the survey labeled "intermediate," as it had characteristics of both zones.
Of the land under permanent cultivation in 1961, which included cropland, land under plantation, and homestead gardens, the survey indicated that some 75 percent was in the wet and intermediate zones and about 25 percent was in the dry zone. Chena cultivation, on the other hand, was predominantly in the dry zone, as were the grass, scrub, and forestlands. Although forest covered almost half the country, only about 0.2 percent and 3.1 percent of the forests were characterized as of high and intermediate yield, respectively. The study further indicated that approximately 70 percent of the land in the wet zone was under permanent cultivation, whereas in the dry zone under 12 percent was being cultivated on a permanent basis.
Since 1961 irrigation has enabled a much greater proportion of land in the dry zone to be cultivated and in 1978 it was estimated that nearly one-third of the country's dry-zone area was under permanent cultivation (see fig. 8). This proportion increased in the 1980s, when lands irrigated by the Accelerated Mahaweli Program were added to the total. As a result, the proportion of forestland declined and was estimated at just under 40 percent in 1987.
Figure 8. Agriculture and Land Use, 1988
Source: Based on information from "Agro-Bio-Environmental Chart of Sri Lanka," Tokyo: Resources Council, Science and Technology Agency, 1977.
Although the forests had few high-yield timber stands, many areas suffered from deforestation because of the heavy demand for firewood in the 1980s. In 1987 it was estimated that 94 percent of households used firewood for cooking. Scarcities of firewood led to price increases well above the general level of inflation in the 1980s.
Government support for farmers takes several forms, including the provision of credit for producers, the setting of minimum prices for agricultural produce, the building of irrigation works, and the encouragement of internal migration to newly irrigated areas. Since the late colonial period, the government has played a growing role in the provision of credit to smallholders on favorable terms. Until 1986 the main instrument of this policy was the subvention of cooperative societies. Agricultural credit took three forms: short-term loans to farmers for the purchase of seeds and fertilizers; medium-term loans, intended for the purchase of machinery; and long-term loans for capital expenditure on storage, transport, and rice-milling apparatus. The long-term loans were not available for individual farmers, but were used by the cooperative societies to acquire infrastructural facilities.
The actual performance of credit provision through cooperatives generally fell short of expectations. Institutional credit did not displace the older sources of credit, such as the village moneylender, friends, and relatives. The inability to repay loans, procedural difficulties, and the existence of unpaid loans already taken from the cooperatives were some reasons given by farmers for preferring noninstitutional credit sources. Another problem with the credit furnished by cooperatives was the high rate of default. This rate may have been attributable partly to real difficulties in repayment, but it also was the result of a widely held impression that government loans were a form of social welfare and that it was not necessary to repay them.
The New Comprehensive Rural Credit Scheme implemented in 1986 sought to increase the flow of credit to smallholders. The Central Bank guaranteed up to 50 percent of each loan in the event of losses incurred by banks lending under the program, and eligible farmers received a line of credit for three years. Loans were automatically rescheduled at concessional rates when crops were damaged by events beyond the farmer's control. In 1986 cultivation loans under this program amounted to nearly Rs257 million, about 74 percent for paddy and the rest for other food crops.
Another important policy was the Guaranteed Price Scheme, which came into effect in 1942. Under this program the government agreed to purchase rice and some other produce at set prices. The intention was to support the farmer's standard of living. For a period in the early 1970s, when the island was threatened by food shortages, the government ordered peasants to market all of their rice through this scheme and at times set the price at a level lower than that of the free market. This policy had the effect of reducing the incentive to grow rice. The program lost some of its impetus in the 1980s. In 1986 the government set the price below the free-market rate for most of the year. As a result of the policy, purchases under the program accounted for only about 6 percent of the rice crop, mostly from districts where private traders were unwilling to operate because of the poor security situation.
Since the 1930s, governments have promoted irrigation works and colonization projects in the dry zone in an attempt to increase rice production and reduce land pressure and unemployment in the more densely settled wet zone. The lack of infrastructure and the prevalence of malaria hampered these programs in the early years. After the near eradication of malaria, increased government investment in infrastructure and enhanced financial support for migrants made the new lands more desirable. Between 1946 and 1971, the proportion of the population living in the dry zone increased from 12 to 19 percent (see Population , ch. 2).
At the end of 1968, about 352,000 hectares were under irrigation for rice cultivation; some 178,000 hectares under major storage reservoirs and barrages, and approximately 174,000 hectares in minor irrigation projects. In the 1970s and 1980s, governments pursued major irrigation programs, most notably the Mahaweli Ganga Program, which was lent added impetus and became the Accelerated Mahaweli Program in 1978. The increasing size of the Mahaweli project dwarfed its earlier endeavors. According to the plan, approximately 593,000 hectares of previously arid land would be brought under irrigation by 1992. In 1986 some 76,000 hectares of new land were under cultivation as a result of this project.
Other long-standing government policies designed to help farmers included subsidies for fertilizer, seed paddy, and other inputs. Government efforts also partly contributed to the adoption of improved cultivation practices and high-yielding seed varieties in paddy farming in the 1960s.
Modern land tenure policy dates from the Land Development Ordinance of 1935, which forbade the transfer of crown lands for purposes of cultivation except to enlarge the landholdings of near-landless or landless peasants. The intent of this ordinance was to help small farmers whose livelihood was seen to be at risk from the exploitation of rich peasants and urban landowners.
In 1958 the Paddy Lands Bill was enacted, mainly to benefit the tenant farmers of some 160,000 hectares of paddy land. The bill purported to assist tenants to purchase the land they worked, to protect them against eviction, and to establish a rent ceiling at around 25 percent of the crop. It also established cultivation committees, composed of rice farmers, to assume general responsibility for rice cultivation in their respective areas, including the direction and control of minor irrigation projects. Shortcomings in the law and official indifference in enforcing the act hampered its effectiveness, and many observers termed it a failure. In some regions tenants who tried to pay the lower, official rents were successfully evicted by landlords, and the old rents, often about 50 percent of the produce, remained in force. In the 1980s, however, the rent ceiling of 25 percent was effective in most districts.
The Land Reform Law of 1972 imposed a ceiling of twenty hectares on privately owned land and sought to distribute lands in excess of the ceiling for the benefit of landless peasants. Because both land owned by public companies and paddy lands under ten hectares in extent were exempted from the ceiling, a considerable area that would otherwise have been available for distribution did not come under the purview of the legislation. Between 1972 and 1974, the Land Reform Commission took over nearly 228,000 hectares, one-third of which was forest and most of the rest planted with tea, rubber, or coconut. Few rice paddies were affected because nearly 95 percent of them were below the ceiling limit. Very little of the land acquired by the government was transferred to individuals. Most was turned over to various government agencies or to cooperative organizations, such as the Up-Country Co-operative Estates Development Board.
The Land Reform Law of 1972 applied only to holdings of individuals. It left untouched the plantations owned by joint-stock companies, many of them British. In 1975 the Land Reform (Amendment) Law brought these estates under state control. Over 169,000 hectares comprising 395 estates were taken over under this legislation. Most of this land was planted with tea and rubber. As a result, about two-thirds of land cultivated with tea was placed in the state sector. The respective proportions for rubber and coconut were 32 and 10 percent. The government paid some compensation to the owners of land taken over under both the 1972 and 1975 laws. In early 1988, the state-owned plantations were managed by one of two types of entities, the Janatha Estates Development Board, or the Sri Lanka State Plantation Corporation.
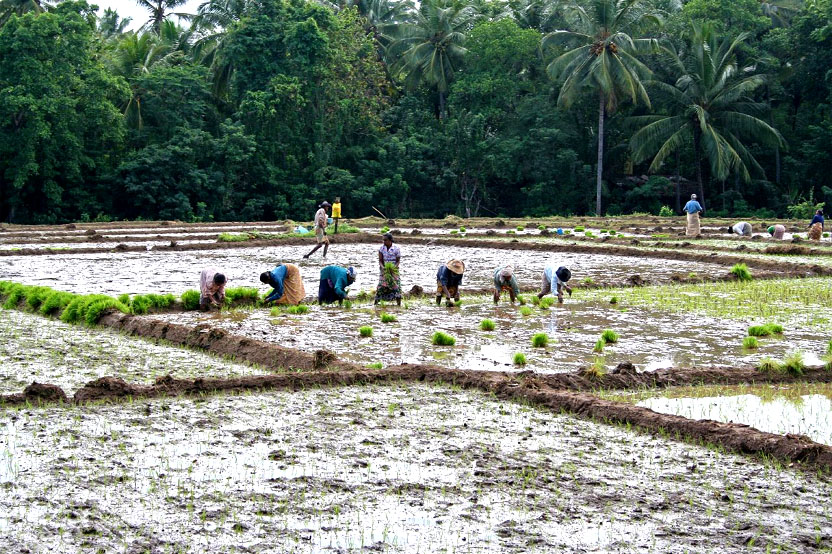
Abb.: Auspflanzen der Reissetzlinge
[Bildquelle: Axel. --
http://www.flickr.com/photos/ax-ro/74936505/. -- Creative Commons Lizenz
(Namensnennung, keine Bearbeitung, keine kommerzielle Verwendung). -- Zugriff am
2006-06-25]
Rice cultivation has increased markedly since Independence, although in the late 1980s yields remained well below those of the major rice-producing countries. Much of the improvement came in the late 1970s and 1980s. Rice remained a smallholder's crop, and production techniques varied according to region. In some villages, it was still sown by hand, with harvesting and threshing often engaging the entire family, plus all available friends and relatives.
Because no completely perennial sources of water exist, there was uncertainty regarding the adequacy of the supply each year. In the wet zone, flooding and waterlogging was experienced in the 1980s, whereas in the dry zone even the irrigated areas were subject to the possibility of insufficient water. In the mid- and up-country wet zone areas, most fields were sown twice a year in the 1980s; in the dry zone most holdings were sown only once; and in the low-country wet zone the amount of flooding or waterlogging determined whether to plant once or twice. The maha (greater monsoon--see Glossary) crops are sown between August and October and harvested five or six months later; the yala (lesser monsoon--see Glossary) crops sown between April and May and harvested about four or five months later.
Despite some increases in productivity, rice output was disappointing in the 1960s and early 1970s. Greater incentives to farmers after 1977 contributed to increases in production. Both the area under cultivation and the yield increased steadily between 1980 and 1985, when annual output reached 2.7 million tons, compared to an annual output of around 1.4 million tons in the early 1970s. In 1986 unfavorable weather and security difficulties led to a slight decline in production. A severe drought affected the crop in 1987, when output was estimated at only 2.1 million tons.
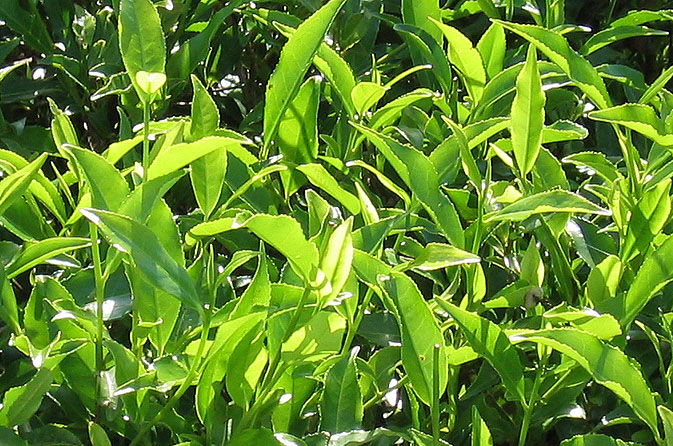
Abb.: Tee
[Bildquelle: Lawrence Sinclair. --
http://www.flickr.com/photos/lws/144294301/. -- Creative Commons Lizenz
(Namensnennung, keine Bearbeitung, keine kommerzielle Verwertung). -- Zugriff am
2006-06-25]
Tea is Sri Lanka's largest export crop. Only China and India produce more tea. The plants, originally imported from Assam in India, are grown in the wet zone at low, middle, and high altitudes, and produce a high-grade black tea. The higher altitudes produce the best tea, and terracing is used to eke out the limited area of upper altitude land. Tea cultivation is meticulous and time consuming, requiring the constant and skilled attention of two or three workers per hectare. Because of this requirement, tea is most efficiently grown on estates, based on large capital investment and having a highly organized and disciplined management and labor supply.
Because working and living on estates was not attractive to Sinhalese peasants, the labor supply for the tea industry from its inception was provided by Indian Tamil immigrants who lived on the estates. Since independence the number of Sinhalese workers has increased, but in the late 1980s Tamils still dominated this sector (see Ethnic Groups , ch. 2).
The performance of the tea industry was disappointing in the 1970s and early 1980s, because of poor producer prices and low productivity. Tea production was 211 million kilograms in 1986, down from 220 million kilograms in 1969. The fundamental problem of the tea estates was the advanced age of the tea bushes. In 1987 their average age was around sixty years and only 15 percent of the total area under tea had been replanted with high-yielding varieties. Replanting had been neglected in the 1960s and 1970s partly because low tea prices and high export duties meant that profit margins were not high enough to make it a profitable enterprise. Between 1972 and 1974, the growing risk of nationalization also discouraged investment.
Rubber continues to be an important export crop in the late 1980s. It thrives under plantation conditions in the wet zone, although a significant proportion of the crop is produced by smallholders. Although rubber yields improved greatly in the first twenty years after independence, both the output and area planted with rubber declined in the 1980s. Output fell from 156 million kilograms in 1978 to 125 million kilograms in 1982. Improved prices caused production levels to recover to about 138 million kilograms in 1986.
Despite the importance of rubber, a large number of rubber plantations suffer from old age and neglect. The government offered incentives to encourage replanting and improve maintenance procedures. Nevertheless, the area replanted in 1986 was 12 percent less than in 1985. This drop in replanting resulted from a shortage of seeds and the reluctance of farmers to retire land from production at a time of relatively attractive prices. In early 1988, however, the short- and medium-term outlook for world rubber prices was considered good.
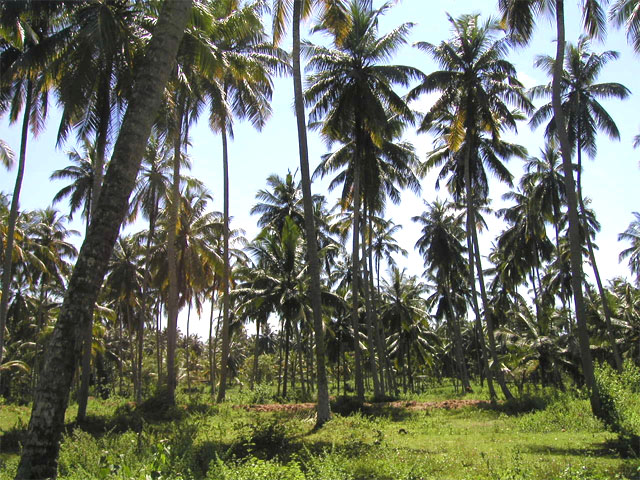
Abb.: Kokosnuss-Pflanzung, Minuwangoda, 2004
[Bildquelle: DennisSylvesterHurd. --
http://www.flickr.com/photos/dennissylvesterhurd/40612174/. -- Creative
Commons Lizenz (Namensnennung, keine kommerzielle Nutzung). -- Zugriff am
2006-06-25]
Most of the coconut production was sold in the domestic market, which consumed about 1.4 billion nuts in the mid-1980s. Most of the rest of the crop, usually between 2 billion and 3 billion nuts, was exported as copra, coconut oil, and desiccated coconut. Local uses for coconut include timber for construction, leaves for thatch and siding, coir for rope and rough textiles, and toddy and arrack for alcoholic beverages.
Coconut output fluctuates depending on weather conditions, fertilizer application, and producer prices. In the 1980s, smallholders dominated its production, which was concentrated in Colombo and Kurunegala districts and around the city of Chilaw in Puttalam District. Because of a drought in 1983, production suffered a setback during 1984 and fell to 1.9 billion nuts, its lowest level since 1977. The recovery during 1985 was impressive, leading to the record production of almost 3 billion nuts. This level was itself surpassed in 1986, when production rose a further 3 percent. But the average export price fell by 45 percent in 1985 and by 56 percent in 1986. In 1986 the farm gate price probably fell below the cost of production, and in early 1988 it appeared that fluctuations in the world price of coconut products would remain a problem for the foreseeable future. The 1987 drought was expected to reduce coconut production by at least 20 percent in both 1987 and 1988. Like tea and rubber, the coconut sector suffered from inadequate replanting. Consequently, a large proportion of the trees were old and past optimum productivity levels.
The importance of crops other than tea, rubber, and coconut increased after 1970, and in 1986 they accounted for around 51 percent of agricultural output. There was a substantial increase in of minor food crops, including soybeans, chilies, and onions, all of which are grown as subsidiary crops on land irrigated by the Mahaweli project. In the 1960s and earlier, vegetables were imported from India in large quantities, but in the 1980s the island's import requirements were much smaller. Spices, including cloves, nutmeg, cardamom, and pepper, also registered large gains in the 1970s and 1980s. A large proportion of the spice output was being exported in the 1980s. Other crops of importance included corn, millet, sweet potatoes, cassava, dry beans, sesame seed, and tobacco. A wide variety of tropical fruits, including mangoes, pineapples, plantains, and papayas, also were grown; most were consumed in the domestic market. Sugar output increased in the early 1980s, although in 1986 it still accounted for only 11 percent of the domestic consumption. The expansion in sugar took place despite the problems of the state-run sugar mills and their associated sugar lands in Eastern Province, which have been disrupted by civil strife. Two new mills in Western Province accounted for the increase in production, and in early 1988 the outlook for further expansion was good.
Industry, including manufacturing, mining, energy, transportation, and construction, accounted for around 38 percent of GNP in 1986. The most important products included refined oil, textiles, gems, and processed agricultural products. Construction and tourism both grew rapidly in the late 1970s and early 1980s, but contracted after the onset of ethnic violence in 1983. State-owned corporations accounted for over 50 percent of total industrial output. An investment promotion zone was established in 1979 with the goal of attracting foreign capital; textile factories accounted for a large proportion of investment there in its early years. The island's electricity supply was mainly fueled by hydropower (see Energy , this ch.).
Sri Lanka developed little industry under British rule, relying instead on the proceeds from agricultural exports to buy manufactured goods from other countries. Most industry during the colonial period involved processing the principal export commodities: tea, rubber, and coconut. Although these sectors remained important, in the 1980s there was a much greater variety of industrial establishments, including a steel mill, an oil refinery, and textile factories.
Industrial diversification began in the 1960s with the production of consumer goods for the domestic market. This trend was a consequence of government measures aimed at saving foreign exchange, which made it difficult to import many items that had previously been obtained from overseas. Heavy industries were established in the late 1960s, mostly in the state sector. During the 1970-77 period the state assumed an even greater role in manufacturing, but after the economic reforms of 1977 the government attempted to improve prospects for the private sector. The fastest growing individual sector in the 1980s was textiles, which made up approximately 29 percent of industrial production in 1986. The textiles, clothing, and leather products sector became the largest foreign exchange earner in 1986. Over 80 percent of the manufacturing capacity was concentrated in Western Province, particularly in and around Colombo.
The enactment of the State Industrial Corporations Act of 1957 provided for the reconstitution of existing state enterprises as well as the establishment of new corporations to promote the development of large-scale and basic industries. The period 1958 to 1963 witnessed the first phase in the rapid growth of state industrial corporations. By 1963 fourteen such corporations were engaged in such fields as textiles, cement, sugar, paper, chemicals, edible oils and fats, ceramics, mineral sands, plywood, and leather. By 1974 there were twenty-five state corporations, including such major undertakings as a steel mill and an oil refinery.
Despite the 1977 policy shift in favor of the private sector, in early 1988 government-controlled enterprises continued to play a major role in industry. State-owned corporations accounted for nearly 60 percent of total industrial output. The most important public company was the Ceylon Petroleum Corporation, which accounted for about 55 percent of all public-sector production.
From the beginning, many industrial corporations in the state sector were troubled by such problems as management inefficiency, technical deficiencies in planning, overstaffing, and defective pricing policies. These difficulties contributed in many undertakings to poor economic results. Moreover, public sector enterprises were associated with objectives that reflected both growth and welfare considerations for the economy as a whole. They became the chief instruments furthering state ownership and social control in the economy, and they were expected to promote capital formation and long-term development. At times they were also looked upon chiefly as major sources of employment and enterprises providing goods and services to the public at relatively low prices. As a result, a number of the state industrial corporations have lost money. In 1987 the debts of state-owned corporations were Rs19 billion, of which Rs15 billion were owed to foreign sources and Rs4 billion to the two state-owned banks.
The liberalization of the economy in 1977 was largely prompted by the perceived inefficiency of the public sector, not by any ideological commitment to free enterprise. As a result, the government let private enterprise compete with the state corporations but took few steps to dismantle the state sector. Instead, it attempted to improve its efficiency. One major state venture, the National Milk Board, was dissolved in 1986, however. It had been established in 1953, but had never succeeded in developing the milk industry. In 1987 it was reported that consideration was being given to transferring to private control several state-run industrial enterprises. These included the four government textile mills, the State Distilleries Corporation, the National Paper Corporation, the Mineral Sands Corporation, Paranthan Chemicals, Sri Lanka Tyre, and Union Motors. In early 1988, however, doubts remained about the extent of the government's commitment to this program. Although the plan to sell the textile mills was expected to be implemented within two years, some of the government's economic advisers reportedly were urging the government to proceed cautiously in its privatization policy, in view of the limited capital markets, the concentration of private wealth, and the weak regulatory framework.
The share of manufacturing in the economy declined from 21 to 15 percent of GDP between 1977 and 1986. This fall is somewhat misleading because it resulted in large part from the rapid growth in the service sector and the decline in output of the state-owned Ceylon Petroleum Corporation. The latter accounted for as much as one-third of the value of manufactured goods in some years and thus strongly affected aggregate manufacturing statistics. These statistics fluctuated along with changes in the value of the output of the oil refinery, which in turn varied with oil price levels and the extent of plant closings for maintenance. Some manufacturing sectors grew rapidly during this period.
Manufacturing was dominated for most of the twentieth century by the processing of agricultural produce for both the export and domestic markets. The most important industries were engaged in preparing and packaging for outside markets the principal export commodities--tea, rubber, and coconuts--for which Sri Lanka is noted. Such preparation generally involved low technology, comparatively modest capital investment on machinery, and uncomplicated, sequential procedures. Tea leaves, for example, follow a four-part process of withering, rolling (to extract bitter juices), fermentation, and heating (or roasting), before being packed in chests for export.
The processing of coconut and of rubber also were important industries, although their ratio in proportion to all manufacturing fell in the 1970s and early 1980s. The processing of the latter two commercial crops generally involved refining the basic commodities into a range of semi-finished products to be used in manufacturing finished goods at home or abroad. Coconuts, for example, are transformed into copra, desiccated coconut, coconut oil, fiber, poonac (a meal extract), and toddy. Copra and desiccated coconut are used as oils or as ingredients in food such as margarine; coconut oil is used to make soap; coconut fibers such as coir are used to make yarn, rope, or fishnets, while poonac is used as food for livestock. The coconut palm flower is also used in the production of alcoholic beverages.
Rubber is also processed in various ways, including latex or scrap crepe and ribbed or smoked sheet, which together account for much of Sri Lanka's export of this commodity. Processing methods for rubber are outdated, however, and Western consumer countries have protested against the hardness, high moisture content, and inconsistent quality of the Sri Lankan product.
Manufacturing received a boost in the early 1960s when import controls, which were the result of shortages in foreign exchange, made it difficult for consumers to obtain or afford foreign products. The result was a protected and profitable ready-made home market. This situation led to an expansion of both privateand public-sector manufacturing, with the private sector concentrating on consumer goods. These new enterprises, however, depended heavily on imported raw materials, and when the country's balance of payments difficulties became even more serious in the early 1970s, industry suffered from the lack of foreign exchange. In 1974 it was estimated that only 40 percent of the capacity of the industrial sector was used. After the 1977 liberalization, raw materials were more freely available, and in 1986 capacity utilization was estimated at 78 percent.
In 1978 the government established the Greater Colombo Economic Commission primarily to serve as the authority for the free trade zones to be set up near the capital. The first investment promotion zone consisted of a large tract that was established in 1979 at Katunayaka, near the Bandaranaike International Airport. A second zone was inaugurated in 1986 at Biyagama, in Colombo District. Foreign companies that built factories in the zones received generous tax concessions. The commission succeeded in attracting some foreign investment, especially from Hong Kong and other Asian countries. At the end of 1985, a total of 119 enterprises had signed agreements with the commission, but only 7 were signed in 1986, when there were 72 units in production. The total number of people employed was nearly 42,000. Gross export earnings from the investment promotion zones in 1986 were around Rs5.5 billion, up 43 percent from 1985. Foreign investments outside the free trade zones were coordinated by the Foreign Investment Advisory Committee.
The principal change in manufacturing in the 1980s was the rapid growth of the textile sector, from 10.5 percent of output in 1980 to 29.2 percent in 1986 (see table 8, Appendix A). In the mid-1980s, the government was attempting to diversify foreign investment away from textiles. Most textile factories were located in the investment promotion zones.
During the July 1983 riots, 152 factories were destroyed, but there was little long-term effect. Some observers expressed the view that the equipment destroyed was inefficient, and that modernization was long overdue.
Total expenditure for construction was estimated at 7.7 percent of GDP in 1986. The sector was given a boost by the ambitious public investment program of the government that came to power in 1977. Between 1977 and 1980, construction expanded at an annual rate of 20 percent in real terms. It stagnated in the 1980s as the number of new projects dwindled and the early ones were completed.
The largest construction project of the post-1977 period was the Mahaweli irrigation program. Conceived in the 1960s as the Mahaweli Ganga Program, the project originally was expected to bring approximately 364,000 additional hectares of land under irrigation and to provide an extra 540 megawatts of hydroelectric power to the national grid. Completion of the program was to require thirty years. Construction of the first two dams was completed in 1977 and opened about 53,000 hectares of new land to irrigation in a general area south of the old capital of Anuradhapura in the dry zone. When the United National Party swept into power in 1977, the project was given renewed impetus and renamed the Accelerated Mahaweli Program. Construction work was undertaken at five new sites between 1979 and 1982, with the intent of increasing the hectares under irrigation and generating an extra 450 megawatts of hydroelectric power for the national grid. By the end of 1987, new dams and reservoirs had been completed at Kotmale, Randenigala, Maduru Oya, and Victoria. The operational power stations at Randenigala and Victoria together generated 330 megawatts of power, with an additional 147 megawatts expected when the Kotmale station came on line. All construction related to the Accelerated Mahaweli Program was scheduled for completion by 1989. The total cost of the entire project was estimated at US$1.4 to 2 billion.
The Urban Development Authority was established in 1978 to promote integrated planning and development of important urban locations. Its responsibilities have included the new parliamentary buildings and the reconstruction of St. John's fish market in Colombo. Total expenditure of the Urban Development Authority was Rs529 million in 1986, well under its annual budget in the early 1980s. The Million Houses Program was established in 1984 to coordinate both public and private housing construction. In early 1988 the government's policy was to subsidize private housing rather than undertake extensive public housing programs.
Gemstone prospector near Ratnapura
Courtesy Paige W. Thompson
Mining is carried out in both the public and private sectors. The most valuable products are precious and semiprecious stones, including sapphires, rubies, cats' eyes, topaz, garnets, and moonstones. Official exchange earnings from gems were negligible in the first two decades after independence because most of the output was smuggled out of the country. The setting up of a publicly owned State Gem Corporation in 1971 and export incentives for those exporting through legal channels brought a marked improvement. In 1986 legal exports were valued at Rs755 million, but many observers believed that a considerable quantity was still being exported illegally. In the late 1980s, Japan remained the most important market for Sri Lanka's gems. The Moors traditionally have played an important role in the industry (see Ethnic Groups , ch. 2).
Graphite also is of commercial significance. Almost the entire output is exported as crude graphite (plumbago). Ilmenite, a mineral sand used in the manufacture of paint and the fortification of metals, also is exported. Salt is produced by evaporation for the domestic market. Thorium deposits have been reported in Sabaragamuwa Province and in the beach sands of the northeast and southwest coasts. Exploration also has disclosed the presence of apatite (source of phosphate), dolomite (fertilizer component) and small pockets of economically extractable iron ore (see fig. 9).
Figure 9. Industry, Mining, and Power, 1988
Over 70 percent of the island's total energy consumption was satisfied by firewood, agricultural residues, and animal waste, mostly for household use. The country had no coal or petroleum deposits, and the only other indigenous energy source was hydropower.
In 1927 the Department of Government Electrical Undertakings, now called the Ceylon Electricity Board, took over the transmission of electricity throughout the country. Hydroelectric power came into use in 1951 with the commissioning of the Laksapana project in Central Province. Demand for power increased from approximately 20 megawatts in 1951 to nearly 73 megawatts in 1963, about 90 percent of which was met from hydroelectric sources. In the 1970s, the island increasingly came to rely on imported oil for the generation of electricity, but new hydroelectric capacity from the Mahaweli project in the 1980s reduced the importance of oil. In 1986 total installed capacity was 1,010 megawatts, of which 74 percent was from hydropower.
In early 1988, it appeared that the Mahaweli project would solve Sri Lanka's electricity supply problem for the foreseeable future. This integrated power generation and irrigation project started contributing to power supplies in 1984 when the first two phases of the Victoria Dam were completed, adding 140 megawatts to installed power capacity. In April 1985, the final stage of the Victoria Dam increased capacity by 70 megawatts. A slightly greater capacity was expected to result in the late 1980s.
United States and British-owned oil companies in Sri Lanka were nationalized in 1963, and since then the importing, refining, and distributing of all oil products has been the responsibility of the Ceylon Petroleum Corporation, the state oil company. Its oil refinery started production in 1969. The main products in 1986 were fuel oil (559,497 tons), heavy diesel (60,995 tons), auto diesel (406,569 tons), kerosene (153,692 tons), and gasoline (123,089 tons).
Figure 10. Transportation System, 1988
In 1987 the road network extended 74,954 kilometers, of which 25,504 were maintained by the Ministry of Highways and the remainder by local governments (see fig. 10). During 1984 the government embarked on a five-year road maintenance program at an estimated cost of Rs5 billion, to be financed by loans from the World Bank (see Glossary) and the Asian Development Bank, together with a grant from Japan. The total number of registered motor vehicles in 1986 was about 478,000.
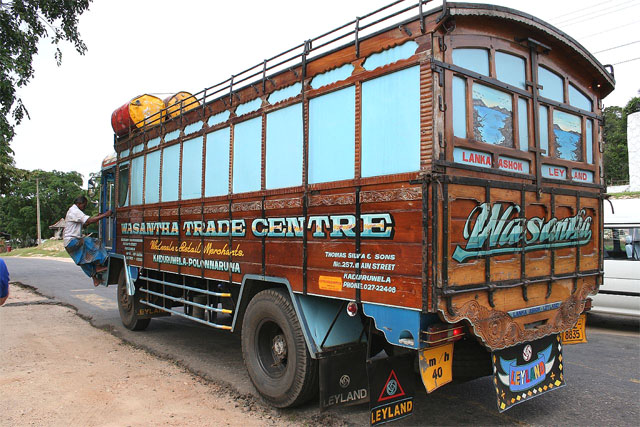
Abb.: Bus
[Bildquelle: Axel. --
http://www.flickr.com/photos/ax-ro/74935068/. -- Creative Commons Lizenz
(Namensnennung, keine Bearbeitung, keine kommerzielle Verwendung). -- Zugriff am
2006-06-25]
Road haulage is handled by private companies; some businesses also have their own trucking operations. After 1978 container transport became an important mode of freight haulage for exports produced in the investment promotion zones. Intercity haulage is carried out by trucks. Bullock carts remained important in rural and suburban areas in the 1980s.
The Ceylon Transport Board had the sole responsibility for providing public passenger road transport from 1957 to 1978. Fares were heavily subsidized, but overcrowding was severe. In 1978 private buses were again allowed to operate, and the Sri Lanka Transport Board and nine regional transport boards replaced the Ceylon Transport Board. The Sri Lanka Transport Board had responsibility for overall transport policy, budgeting, and production planning, whereas the regional boards were responsible for the operation of regular regional and interregional bus services. In 1986 the revenue-cost ratio of the regional boards was 89 percent. Private road transport expanded rapidly in the late 1970s and early 1980s, but as in the state sector, there was some contraction in the mid-1980s as a result of the declining security in the northern and eastern parts of the country. In 1986 the private sector accounted for about half of the passenger-kilometers. Many buses in both the state and private sectors were in poor condition.
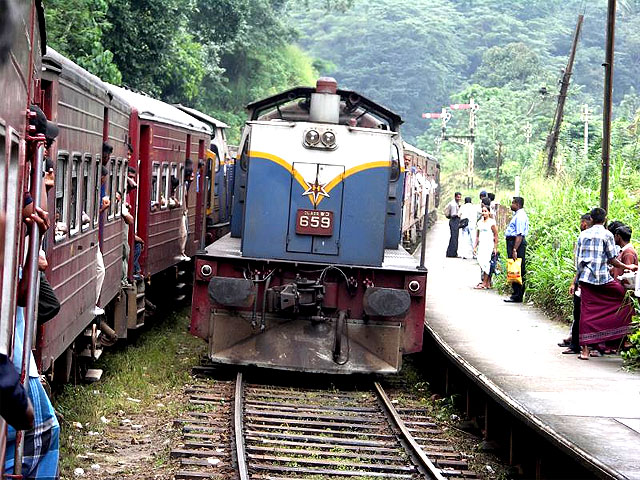
Abb.: Bahnstation bei Colombo
[Bildquelle: Graham and Sheila. --
http://www.flickr.com/photos/74698556@N00/66551689/. -- Creative Commons
Lizenz (Namensnennung). -- Zugriff am 2006-06-25]
The island's first railroad line, from Colombo to Kandy, was opened in 1867, and in the 1980s Sri Lanka Railways had 1,944 kilometers of railroad track. In early 1988, service in Northern and Eastern provinces had been irregular for several years. The network's passenger-kilometers amounted to 1.9 billion in 1986, about 38 percent less than its total in 1982. Freight services, on the other hand, remained fairly steady in the mid-1980s. The railroads have been operated at a loss since independence.
Three ports can accommodate deep water vessels: Colombo, Trincomalee, and Galle. Colombo was by far the most important. In 1985 it handled nearly 3 million tons of cargo compared with about 600,000 jointly handled by the other two ports. In 1986 the Ceylon Petroleum Corporation began a project to build a single-point buoy mooring 9.6 kilometers offshore from Colombo port. When completed, this project will greatly reduce the costs of discharging crude oil to the refinery near Colombo.
In 1971 Sri Lanka launched its own merchant fleet. The state-owned Sri Lanka Shipping Corporation purchased its first vessel, a 14,000-ton freighter, in March 1971. By 1981 the corporation owned eight ships, including a 20,000 deadweight ton tanker. In 1987 the firm began to replace its aging fleet.
Colombo is a stopping place on international air routes between Europe and the Asia-Pacific region. The first stage of a redevelopment plan for the Bandaranaike International Airport at Katunayaka was completed in October 1986 with the opening of a new runway, built at a cost of Rs517 million. Some foreign airlines reduced or suspended services in the mid-1980s because of declining traffic due to the security situation.
Air Lanka, the nation's flag carrier, was established in 1980, and in early 1988 it connected Sri Lanka with Europe, the Middle East, and South and Southeast Asia. It was 60 percent government owned. In 1987 a presidential commission set up to inquire into the airline's financial affairs accused former members of the airline's board of subordinating the company's development to their private gain. Taking into account the realizable value of its assets and other costs associated with a forced sale, estimated cumulative losses up to the end of the fiscal year 1986 were Rs7.7 billion, or about Rs1.3 billion for each year of operation. In early 1988, a foreign airline was reportedly being sought to manage Air Lanka and turn it into a viable enterprise.
In 1988 Sri Lanka's domestic and international telecommunications services were operated by the Posts and Telecommunications Department, of the Ministry of Posts and Telecommunications. Communications with most countries were available through telephone and telex services; an international direct dialing service was introduced in 1980 and by 1987 was in operation in most parts of the country. Advances in the telecommunications field, however, had not kept pace with the growth in the economic sector occurring since the 1970s. In the 1980s, the quality and availability of telecommunications services in Sri Lanka was average compared to other Asian countries, but poor compared to other parts of the world. With approximately 106,500 telephones in use in 1986, the telephone network was extremely overloaded, the exchanges nearing or exceeding capacity levels. Line congestion and long waiting lists for telephone connections were common. Telephone lines were concentrated in urban areas, with over 60 percent located in the Colombo area, which houses only 5 percent of Sri Lanka's population. Direct dialing was available within Colombo and to some major towns, but operator assistance was necessary for other connections, which often led to long delays.
The Sri Lanka Broadcasting Corporation operated radio services, and the Sri Lanka Rupavahini Corporation and the Independent Television Network operated television services in the 1980s. In 1987 almost 700 hours of weekly radio programming were broadcast domestically in Sinhala, Tamil, and English. Programs were transmitted internationally via a shortwave station at Ekala, and domestically through twenty-four medium-wave stations and FM stations located in five cities throughout Sri Lanka (see table 9, Appendix A). Over 2 million radio sets were in use in the mid-1980s. Foreign service broadcasts to Asia, Europe, Africa, and the Middle East were transmitted from Ekala in eight languages (English, Hindi, Kannada, Malayalam, Nepali, Sinhala, Tamil, and Telugu). Independent foreign broadcasts transmitting programs from Sri Lanka included the Deutsche Welle station at Trincomalee, and Voice of America radio station at Colombo, and the religious stations of Trans-World Radio and Adventist Radio.
Television transmissions began in 1979 and by 1986 there were some 350,000 receivers in place. Programs were broadcast over three channels in Sinhala, English, and Tamil for four hours daily via the main transmitter at Pidurutalagala, Nuwara Eliya District, and two relay stations at Kokkaville in northern Batticaloa District and Kandy. The Independent Television Network broadcast over one channel from the station at Wickramasinghapura.
International telecommunication services were provided mainly by the Padukka satellite station and the South East Asia-Middle East-Western Europe submarine cable system. The earth station, commissioned in 1975, continued to provide international telephone and television services via the Indian Ocean Region INTELSAT satellite. The submarine cable station located at Colombo was commissioned in 1984. It extended from Singapore to France via six countries (Indonesia, Sri Lanka, Djibouti, Saudi Arabia, Egypt, and Italy) and provided Sri Lanka with international telephone communications.
Sri Lanka was planning to invest Rs2.5 billion in telecommunications in the late 1980s. The advances were slated in the telephone network and other telecommunications services.
Victoria Dam approaches completion, Accelerated Mahaweli Program
Courtesy Embassy of Sri Lanka
The formally employed population of Sri Lanka in the late 1980s was shifting gradually from agriculture to manufacturing, trade, and service employment. Nevertheless, over 40 percent of the work force remained agricultural in early 1988; most of these workers were smallholders, tenants, and plantation workers. The labor force growing most rapidly in the early and mid-1980s was in the service sector.
"More than 20% of the 6.1 million-strong labor force, excluding the north and east, is unionized. Trade union membership is on the decline. There are more than 1,650 registered trade unions, many of which have 50 or fewer members, and 19 federations. Many unions have political affiliations. The Ceylon Workers Congress (CWC) and Lanka Jathika estate workers union are the two largest unions representing workers in the heavily unionized plantation sector. The president of the CWC also is Minister of Livestock Development and Estate Infrastructure. The CWC's agenda includes political issues, such as citizenship status for stateless Indian Tamils. Some of the stronger and more influential trade unions include the Ceylon Mercantile Union, Sri Lanka Nidhahas Sevaka Sangamaya, Jathika Sevaka Sangayama, Ceylon Federation of Trade Unions, Ceylon Bank Employees Union, Union of Post and Telecommunication Officers, Conference of Public Sector Independent Trade Unions, and the JVP-aligned Inter-Company Trade Union. The unemployment rate has declined in recent years and hovers at 10%. The rate of unemployment among high school and college graduates, however, remains proportionally higher than the rate for less-educated workers. The government has embarked on educational reforms it hopes will lead to better preparation of students and fewer mismatches between graduates and jobs. In addition, it also has begun a youth corps program to provide employment skills to the unemployed." [Quelle: http://en.wikipedia.org/wiki/Economy_of_Sri_Lanka. -- Zugriff am 2006-06-26]
A precise breakdown of the labor force and movement within it was not possible in the late 1980s because the official statistics were not reliable. Early censuses, taken when the island was a British colony, compiled long lists of occupations with little comparability from one census to the next. The postindependence censuses also suffer from inconsistencies. They show a decline in the proportion of the work force engaged in agriculture, hunting, forestry, and fishing from 52 percent in 1953 to just over 45 percent in 1981. The proportion of the work force engaged in manufacturing remained steady over the same period, at 10 percent. The largest increase was in services, including commerce, banking, and finance. The proportion of workers in this category rose from 11.2 percent in 1953 to 15.7 percent in 1981. There was also an increase in construction, from 1.9 percent to just over 3 percent. Transport, storage, and communications increased from 3.5 percent to 4.8 percent over the same period. All such figures should be regarded as tentative and subject to revision.
Demographic and educational changes after independence altered the composition of the work force as much as economic development. Rapid population growth brought additional workers into the job market every year and lowered the average worker's age. The growth of the economy was too limited to provide opportunities for the new workers. Similarly, the extension of education qualified many thousands of youths for jobs that did not exist. This fact has been particularly true for women, who in the 1980s made up about 25 percent of the labor force despite equal access to education.
During the nineteenth century, labor legislation dealt with the large plantations, and more general labor laws were passed only in the closing years of colonial rule. In 1941 the government enacted the Wages Boards Ordinance, the first comprehensive piece of legislation regarding the payment of wages, the regulation of working hours, and sick and annual leave; the ordinance also empowered the government to establish wages boards for any trade. The boards are composed of an equal number of representatives of workers and employers and three appointees proposed by the commissioner of labor.
Ordinances of 1942 and 1946 required all factories to be registered and established minimum standards for health and safety. The laws also gave the commissioner the right to send inspectors to the factories and to judge whether a plant was meeting minimum standards. The Shops and Offices Employees Act of 1954 extended the provisions of the factories legislation to small shops.
The Maternity Benefits Ordinance, as amended in 1957, entitled a woman who worked in a factory, mine, or estate to full compensation for a period of two weeks before her confinement and for six weeks afterward. The employee must have worked for the employer 150 days before her confinement to be eligible to receive the benefits.
The Employees Provident Fund, established in 1958, provided a national retirement program for the private sector. The Provident Fund required an employer to contribute 6 percent of total earnings and an employee to contribute 4 percent of earnings exclusive of overtime pay. Participation in this plan grew quickly, and in the 1980s most salaried workers in the formal sectors of the economy were members. Government employees had their own pension plans.
Although legislation protecting the health and welfare of workers was extensive, enforcement was inconsistent. The government departments charged with enforcement were chronically underfunded in the late 1980s. Moreover, many labor regulations were suspended in the investment promotion zones. Most labor legislation also did not apply to rice farming and other economic activities carried out informally.
Working conditions varied greatly according to the type and size of employment activity in the 1980s. The Factories Ordinance of 1942 established guidelines for industrial safety and sanitation and made each factory liable to government inspection. Because this ordinance and other similar legislation has not been enforced consistently, workers frequently protested their working conditions. In the 1980s, strikes and boycotts often took place because of inadequate meals at factories that had their own lunchrooms or because of the lack of other facilities.
The Factories Ordinance prohibited work for women between 9:00 P.M. and 6:00 A.M. In the years after independence, a further series of laws restricted the employment of women and children to designated time periods and places. A 1957 law, for example limited working time for women to nine hours. Other laws prohibited women and children from working time underground, in mines, for example.
Unemployment has been a problem since the 1960s, especially for young people, but the statistics available in 1988 were not very reliable. Observers estimated that unemployment increased from around 12 percent of the labor force in the early 1960s to 24 percent in the mid-1970s. Unemployment fell back to around 12 percent in the first few years after the economic liberalization that began in November 1977, but it was again on the increase in the mid-1980s. According to official data, in 1987 the labor force consisted of around 6.2 million persons, of whom 5.4 million, or 87 percent, were gainfully employed, but these figures understated unemployment, which the Ministry of Finance estimated at 18 percent in late 1987. All of these figures excluded persons said to be underemployed or partially employed, conditions that were prevalent in the rice-farming sector and in some of the urban-based service activities. The extent of labor underutilization, was believed to be much greater than indicated by the statistics for unemployment.
In the mid-1980s, sectors, such as tourism, that were sensitive to the security situation suffered job losses (see Tourism , this ch.). Migration to the Middle East, which also provided jobs in the early 1980s, was also on the decline, although still of substantial importance. In 1987 observers estimated that 100,000 Sri Lankans worked and lived in the Middle East--particularly in the small oil-rich states of the Arabian Peninsula, where wages for comparable work were much higher than in Sri Lanka.
A representative index showing changes in the general level of wages was not available in the late 1980s. Wages were low compared with those paid in developed countries, even in the unionized sectors, and incomes were unevenly distributed. Some indication of wage movements can be gained from the indices of minimum wage rates. These more than doubled between 1978 and 1986, but inflation probably kept their value little changed in real terms. The only price index, the Colombo Consumer Price Index, was based on data gathered in Colombo and was widely believed to understate inflationary increases, especially for the lower wage earners. It recorded an increase of 8 percent in 1986. Although this rate was considerably higher than the 1.5 percent increase recorded in 1985, it was low compared to the two-digit rates that prevailed during the 1978-84 period.
Low wages in the formal sector were partially offset by overtime payments, increments, bonuses, and other incentive programs, which often added considerable supplements to salaries. A five-day work week was standard in the 1980s. Sri Lanka had a large number of public holidays; twenty-four were celebrated in 1985. These included twelve full moon days, which are of religious significance to Buddhists.
The labor movement was large and politically active in the 1980s, although it suffered a loss of influence after 1977. Urban strikes began in the 1890s and increased in number after World War I. The first major labor organization, the Ceylon Labour Union, was formed in 1922. In the 1930s, the legislature passed a series of laws, including the Trade Union Ordinance of 1935, to regulate the unions. This law made it mandatory for trade unions to register with the government and to keep political and labor funds separate. After World War II, the unions represented a large proportion of the labor force, especially in Colombo and on the large plantations. The leadership of nearly all trade unions has come from the English-educated elite.
Union membership in 1988 was subject to fluctuations because of competition among unions affiliated with different political parties and because of personal rivalries among union leaders, as well as a fairly rapid turnover of unions. The unions have traditionally been strong in the state sector, especially rail and road transport, the ports, and the government clerical service. In 1983 observers estimated that about 1.8 million workers, or just under one-third of the gainfully employed labor force, were union members. Membership was fragmented into over 1,000 unions. Many of the unorganized workers were small farmers and rural laborers.
Before 1977 many unions were affiliated with the Marxist parties, especially the Trotskyite Lanka Sama Samaja (Ceylon Equal Society Party), but in the late 1970s and early 1980s the influence of the Jatika Sevaka Sangamaya (National Employees' Union), which was affiliated with the ruling UNP, increased greatly, and it became the single largest trade union. This organization was especially strong in the state sector, and it had a reputation for intimidation, violence, and discrimination against Tamils. Another important trade union was the Ceylon Workers' Congress, which represented a large proportion of the Indian Tamil estate workers. After 1977 it was politically allied with the government, but it nonetheless used the political turmoil after 1983 to bargain for better working conditions.
Labor disputes were arbitrated through a variety of state agencies, but these agencies have not prevented frequent and costly strikes. Plantation strikes have been most common, involving as many as 477,000 workers (in 1949) and as many as 1.12 million lost workdays (in 1966). In the remainder of the private sector, the most turbulent period was in 1962 and 1963, when over 1.28 million workdays were lost by strikes. In 1970 new highs were reached, with 143 strikes and the loss of 1.31 million workdays. In the mid-1970s, when many trade unions pledged not to strike in return for substantial concessions, the number of nonplantation strikes fell dramatically, although plantation strikes increased. Since 1977 the unions in the nonplantation sectors have been in apparent decline, in part because of changes in the nature of the work force. Most employees of the new textile factories in the free trade zone were young, unmarried women doing shift work, who did not expect to be employed there for more than a few years and who were little interested in joining a union. Similarly, employees in the import and tourist industries, sectors that grew in the years after 1977, had not been successfully organized.
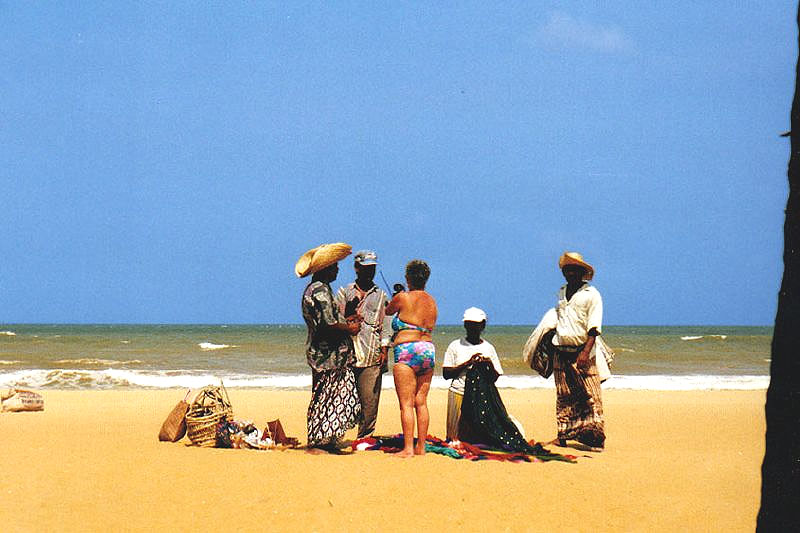
Abb.: Strandhändler, Negombo
[Bildquelle: john worsley uk. --http://www.flickr.com/photos/johndunster/67464311/.
-- Creative Commons Lizenz (Namensnennung, keine Bearbeitung). -- Zugriff am
2006-06-25]
Sri Lanka's economy continues to be heavily dependent on foreign trade. Historically, the island has exported cash crops in order to import food to feed its population. Although the production of rice, the staple food crop, increased rapidly in the late 1970s and 1980s, in early 1988 the island remained short of self-sufficiency in food. Trade policy since independence has been dominated by the deteriorating terms of trade. Between the 1950s and the 1980s, the amount of imports that could be bought with a given amount of the traditional exports has declined. Governments responded in the 1960s and 1970s with strict controls over imports, foreign exchange, and some aspects of internal trade. When the economy was liberalized in 1977, many of these regulations were swept away. One result has been a large increase in the foreign trade deficit and the external debt.
"Trade and Foreign Assistance Exports to the United States, Sri Lanka's most important market, were valued at $1.8 billion in 2002, or 38% of total exports. For many years, the United States has been Sri Lanka's biggest market for garments, taking more than 63% of the country's total garment exports. India is Sri Lanka's largest supplier, with exports of $835 million in 2002. Japan, traditionally Sri Lanka's largest supplier, was its fourth-largest in 2002 with exports of $355 million. Other leading suppliers include Hong Kong, Singapore, Taiwan, and South Korea. The United States is the 10th-largest supplier to Sri Lanka; U.S. exports amounted to $218 million in 2002, according to Central Bank trade data--U.S. Customs data places U.S. exports to Sri Lanka at $166 million in 2002. Wheat accounted for 14% of U.S. exports to Sri Lanka in 2002, down from the previous year.
Sri Lanka is highly dependent on foreign assistance, and several high-profile assistance projects were launched in 2003. The most significant of these resulted from an aid conference in Tokyo in June 2003; pledges at the summit, which included representatives from the IMF, World Bank, Asian Development Bank, Japan, the European Union and the United States totaled $4.5 billion."
[Quelle: http://en.wikipedia.org/wiki/Economy_of_Sri_Lanka. -- Zugriff am 2006-06-26]
An overall measure of the size and shape of the internal market was provided by the Central Bank of Sri Lanka's breakdown of national income according to expenditures by the several sectors of the economy. In 1986 gross domestic expenditure was estimated at Rs200.3 billion. About Rs139.4 billion represented private consumption; Rs18.5 billion was for government consumption; and Rs42.3 billion went into fixed capital investment, of which almost Rs33 billion was in the state sector. The aggregate of private sector expenditures constituted just over 74 percent of total outlays.
No detailed information was available concerning consumer outlays in the late 1980s. Earlier surveys indicated that many families devoted about 50 percent of their total expenditure to food. Some government policies in the 1960s and the early 1970s kept inequalities of consumption relatively low. These measures included the subsidizing and rationing of essential goods, restrictions on imports of luxury goods, and heavy income taxes. The easing of many of these policies after the economy was liberalized in 1977 resulted in higher food prices and a flood of imported luxury items. According to the Consumer Finance and Socio-Economic Survey carried out by the Central Bank in 1978 and 1979, the poorest 10 percent of the population controlled 1.2 percent of total personal income, while the richest 10 percent had 39 percent of personal income.
Traditionally, the state has played an important role in retail trade. The government-controlled Co-operative Wholesale Establishment, which was created during World War II to handle the import and distribution of foodstuffs, had monopolies over the sale of imported sugar, canned fish, cement, hardware, and other products at various times in the 1960s and early 1970s. The monopolies were broken up after 1977, when government policy shifted toward promoting competition. In 1986 however, there still were 8,644 cooperatives serving as retail outlets. As in the past, they relied heavily on the distribution of basic consumer items such as rice, flour, and sugar under the food stamps scheme (see Budgetary Process, Revenues, and Expenditures , this ch.). They also helped overcome shortages of essential goods in areas where security difficulties made private business unwilling to operate. In 1986 their turnover was about Rs1.1 billion.
The ten state trading corporations in existence in early 1988 were expected to be commercially competitive with the private sector. Most were organized around specific commodities, such as building materials, fertilizer, paddy, textiles, gems, and drugs. Their total turnover was around Rs5.6 billion in 1986, down from Rs6.3 billion in 1985.
Importers and wholesalers had their own warehouses, most of them in Colombo, but some in the provinces. For the most part, wholesalers did not actively engage in trying to sell their wares, but left it to retailers to take the initiative. Markup margins varied widely. Inasmuch as traders were not generally in a position to obtain credit from institutional sources, sales tended to be on a cash basis, although the larger wholesalers did extend limited amounts of credit.
Sri Lanka's balance of trade has been in a chronic state of deficit since 1957; the only year between 1957 and 1987 when there was a surplus was 1977 (see table 10, Appendix A). Although the ability to pay for imports has generally declined because of the long-term relative fall in the prices of tea, rubber, and coconut, the demand for imports has been fueled by population growth and rising expectations. The resulting shortage of foreign exchange has been the greatest problem in the economy during the period since independence. For most of the 1960s and 1970s, the government imposed strict import and exchange controls in an attempt to control these deficits. After 1977 the deficits were allowed to grow and were financed by increased foreign support and heavy borrowing.
Few nations have experienced so drastic and long-term a deterioration in terms of trade as did Sri Lanka from the mid-1950s to the mid-1970s. As a result, the volume of imports fell, at first through severe restriction of luxury items, such as automobiles and spirits. But the structure of the economy limited the amount by which imports could be cut. Levels of food, medicines, spare parts, and fertilizer could not easily be reduced without damaging the economy or the population's welfare. The gap was met by borrowing, and debt service obligations further reduced import capacity. Although the volume of exports was nearly 18 percent more in 1975 than in 1960, the proceeds from these exports had a purchasing power worth only 37 percent of the smaller volume of exports in 1960.
Although the general trend in the terms of trade was against Sri Lanka between 1955 and 1988, there were occasional exceptions. The terms of trade showed a 35 percent improvement in 1976 over 1975, and 31 percent in 1977 over 1976, when tea prices experienced an unprecedented rise of 80 percent. From 1979 to 1982, however, the terms of trade again turned sharply against Sri Lanka, reaching record lows in 1981 and 1982. Between 1983 and 1987, the terms of trade hovered near the level for 1981, with the exception of 1984, when an increase in the price of tea produced a temporarily more favorable position.
After the liberalization of the economy in 1977, the trade deficit widened enormously as the import bill soared under the influence of the government's development program. Exports, however, remained largely static. The trade deficit thus expanded year by year and reached nearly Rs20.5 billion in 1982, equal to 22.4 percent of GDP. In 1983, as a result of good agricultural production, the deficit was held to the same level as in 1982. The following year, 1984, the deficit was cut to Rs10.2 billion as a result of exceptionally high tea prices. This gain was not sustained in 1985, when the trade deficit rose to Rs17.8 billion. In 1986, despite a static level of imports attributable primarily to the decline of world oil prices, the trade deficit again widened, to around Rs20.5 billion. Sharply reduced earnings from tea were only partly offset by improved exports of manufactured goods, especially textiles. Preliminary figures for 1987 showed a record trade deficit.
Sri Lanka's major export earnings were derived from a small number of commodities (see table 5, Appendix A). In 1986 textiles overtook tea for the first time as the leading export. Textile exports were worth around Rs9.6 billion, compared to under Rs9.3 billion for tea. Rubber exports, which have declined since the 1970s, were worth Rs2.6 billion in 1986. Coconut products accounted for Rs2.4 billion, fuel oil products for Rs2.3 billion, and gems for over Rs1.6 billion. Other exports, including agricultural produce, graphite, and manufactured goods, were valued at around Rs7.8 billion. This breakdown reflects a substantial diversification of exports away from tea and rubber in the 1970s and 1980s, but in early 1988 the fluctuations in the world prices of these commodities continued to be an important factor not only in the island's export earnings but in the health of the economy as a whole.
Oil accounted for about 25 percent of the value of imports in the early and mid-1980s, but dropped to 11.5 percent in 1986 when its price fell sharply and additional hydroelectric power became available from the Accelerated Mahaweli project. Some of the output of Sri Lanka's single oil refinery was then reexported. Other significant imports included machinery and equipment, chemicals, motor vehicles, clothing, paper, and sugar. Rice imports declined in the late 1970s and early 1980s; by 1985 Sri Lanka was close to self-sufficiency in years with good weather. In 1986 rice accounted for only 1.9 percent of imports.
The United States was the most important foreign market, accounting in 1986 for approximately 26 percent of the island's exports, mostly in the form of textiles and tea. The Federal Republic of Germany (West Germany), Britain, and Japan also were important markets in the 1980s, although no single country other than the United States took more than 8 percent of exports in 1986. The leading source of imports was Japan, which accounted for over 17 percent in 1986. The United Arab Emirates, Saudi Arabia, the United States, Britain, China, and West Germany also were important sources of imports. In the 1960s and 1970s, about 50 percent of rubber exports went to China in return for rice on favorable terms, but after around 1980 Sri Lanka no longer needed to import large quantities of rice. Higher oil prices led to an increasing proportion of imports coming from the Middle East; this was paid for in part with increased exports of tea to this region.
Although the island's balance of payments position was closely related to the balance of trade, foreign aid and remittances from Sri Lankans employed overseas made the balance of payments more favorable than the balance of trade. As a result, Sri Lanka occasionally ran a small balance of payments surplus in the 1960s and 1970s, and again in 1984, when the economy benefited from high tea prices. In 1986 Sri Lanka had a balance of payments deficit of US$406 million, down from US$556 million in 1985. The main factor was the trade deficit of US$750.2 million. Private transfers, mostly remittances, amounted to US$294.5 million, about half of which were from the Middle East. Official transfers, including aid from governments and international organizations, accounted for US$181.2 million. Sri Lanka's services account ran a deficit. Exports of services, including earnings from tourism, were US$378.1 million, while imports in this sector, including interest payments on foreign loans, amounted to US$509.6 million.
In 1948 Sri Lanka had an essentially open-door policy on imports and an optimistic outlook for its foreign trade relations, but deterioration in the value of the country's export earnings led in 1953 to the Exchange Control Act, which placed some restrictions on the movement of foreign currency. In 1961, in response to balance of payments problems, a rigorous system of exchange controls was introduced. Licenses that acted as exchange permits were issued by the controller of imports and exports. All imports and exports were subject to these regulations, and foreign exchange entering the country, whether by way of exports, invisibles, or the movements of capital, had to be surrendered to the exchange control authorities. Only imports of goods classified as essential were permitted. The list of such items became smaller during the 1960s because of the increasing scarcity of foreign exchange and the availability of new items through local production. In the early 1970s, only imports of the barest minimum of foodstuffs, drugs, textiles, raw materials, and capital goods were allowed.
From 1970 to 1977, Sri Lanka had a dual exchange rate system in addition to exchange and import controls. Under the system, imports of indispensable items--such as food and drugs--were allowed at the official rate, while all other imports were subject to a higher rate. Foreign exchange earned from tea, rubber, and coconut was converted into rupees at the official exchange rate, while earnings from all other exports were given the benefit of the higher rate.
In November 1977, the exchange rate system was liberalized as part of the new government's economic reforms. The dual rate system was abolished, and the rupee was set free to float in response to international developments and the balance of payments position. The immediate effect of this measure was a devaluation of around 50 percent; after this time, the rupee continued to fall gradually against the major international currencies. In December 1987, US$1 equalled Rs32.32 compared with Rs19.3 six years earlier.
The balance of payments deficits after the late 1950s led to a large foreign debt, most of which was accumulated after 1978. Rapid increases in the external debt, by comparison with the domestic debt, presented a double burden. Additions to the domestic debt involved only the problem of finding, through taxation, savings, or other means, the necessary additional local currency to meet the additional charges on the interest and amortization payments on the new debt. Increases in the foreign debt, however, required not only the same local currency to meet the enlarged budget item but also additional foreign currencies with which to transfer abroad the increased interest and amortization payments. This situation forced either a reduction in imports or still further borrowing abroad.
Governments addressed the balance of payments deficits in the 1960s by imposing direct controls that restricted imports. Even so they were unable to avoid increases in the foreign debt, which rose from around US$62 million in 1960 to US$231 million in 1969 and US$380 million in 1974. After the 1977 liberalization of the economy, import restrictions were loosened and foreign credit became much more readily available. The total external debt, including short-term loans and trade credits, was estimated to be just under US$4 billion at the end of 1986. Medium-and long-term debt of the government represented about 75 percent of this amount. Another 7 percent was owed by government corporations. Debt service payments on all foreign loans were US$410 million in 1986, up from US$342 million in 1985. Total debt service payments as a ratio of export earnings from goods and services increased from 21 percent in 1985 to 26.7 percent in 1986.
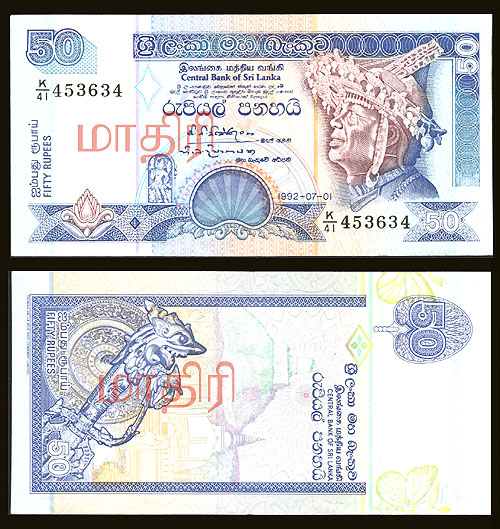
Abb.: Banknoten
[Bildquelle: Wikipedia]
After the early years of independence, the government consistently ran a budgetary deficit, which in the 1980s amounted to 15 percent of GDP. Foreign aid, which increased substantially after 1977, financed over 50 percent of the deficit in the 1980s and was essential for the health of the economy. Historically, a relatively high proportion of government expenditure was on social welfare programs, including health, education, and subsidized food, but after 1977 the importance of these programs, although still substantial by regional standards, declined. Banking and credit were dominated by government-controlled institutions, but the importance of the private sector in financial services was increasing.
The budget is announced annually in the budgetary speech of the finance minister, which is normally made in November. This speech reviews the economic situation of the current fiscal year, which corresponds to the calendar year, previews the government's expenditure program for the next year, and sets forth any proposed changes in taxation. Sometimes adverse public reaction, or pressure from members of parliament within the ruling party, forces changes in the measures announced in the finance minister's speech, but once formally introduced in parliament, the budget proposals are normally passed intact. All money bills must be introduced by a minister acting on behalf of the government. Opposition members may propose amendments to reduce expenditure under a specific head, but the success of such a motion would be a major defeat for the government and would probably cause its resignation. No amendments concerning taxes or to increase expenditure are allowed. Supplementary provisions are often presented by the government during the year. The government's finances are monitored by an auditor-general appointed by the president.
The colonial administration was heavily dependent on indirect taxes, especially import and export duties. Some changes in the structure of the revenue system were set in motion by the report of the Taxation Inquiry Commission, which was published in 1968. At that time, the tax system proper (exclusive of such items as fees, charges, and sales) of the central government consisted of various separate revenue sources: personal income taxes, corporate income taxes, wealth (luxury) tax, business turnover tax, import and export duties, resale of automobiles tax, and the levy on the transfer of property to nonnationals. The system was characterized by high taxes on major exports, by a miscellaneous collection of import taxes, and by high rates of income taxation. The income tax on corporations was 50 percent, and the top marginal rate on individuals was 80 percent, with rapid rates of progression. The wealth tax on individuals was also high.
The Taxation Inquiry Commission concluded that, for steady revenue flow, dependence should be placed on a broad-based set of consumption taxes, with differential rates to minimize the regressive tendency inherent in the consumption tax. This was recommended on a strictly pragmatic basis because both incomes and exports were already being taxed almost to their limit. There was thus no alternative to more and higher import duties and excises to secure the necessary additional revenue. Because the commission believed that taxable imports would in the future be replaced by domestically produced substitutes, it argued that consumption taxes would increasingly have to bear the brunt of the search for new revenue. The commission also advised the government to raise the exemptions, lower the top rates, and ease the progression rate on income, wealth, and gift taxes; to raise the excise taxes on tobacco, arrack, beer, and domestically consumed tea; and to increase the coverage and reduce the exemptions of the turnover tax. Most of these recommendations were implemented soon after the publication of this report.
In 1975 sales and turnover taxes raised almost 30 percent of the government's revenue, and income taxes and tariffs each raised about 15 percent. A little over a decade later, in 1986, the importance of the sales taxes and tariffs had increased, but income taxes raised a smaller proportion of the revenue than earlier (see table 11, Appendix A). In 1986 the general sales and turnover tax raised 15.4 percent of revenue, and selective sales taxes, which were primarily imposed on tobacco and liquor, raised 10.7 percent. Import duties accounted for 24.1 percent and export duties for only 3.8 percent. Income taxes raised 11.5 percent of state funds in 1986, over two-thirds of which came from corporate sources. Studies carried out in the 1970s, both before and after the liberalization of the economy, indicated that the tax system as a whole operated in a progressive manner. Almost 25 percent of the government's revenue in 1986 came from nontax sources, mainly interest, profits, dividends, and other receipts from government-owned enterprises.
In 1988 the maximum rate of personal income tax was 40 percent and the ceiling on both income and wealth tax was 50 percent of a person's income. The 1988 budget reflected a cut in the highest level of import duty from 100 to 60 percent. A large proportion of revenue from business came from the established forms of economic activity because new industries, such as tourism and the free trade zone factories, had preferential tax treatment.
No postindependence government has attempted to change, as a matter of policy, the proportion of the nation's GDP that it takes in revenue. This proportion generally hovered at just over 20 percent between 1950 and 1983. Annual variations derived more from external factors than from changes in government policy. Revenue from export duties on tea, rubber, and coconut, for instance, varies according to the price of these commodities on the international market. In 1984 when the price of tea rose temporarily, the government increased the export duty in order to gain a share of the windfall profits, and total revenue rose to 24.5 percent of GDP. In 1987 government revenue was only slightly below this level because of tax increases brought about by increased fiscal pressures, largely the product of higher defense allocations and the heavy foreign debt.
Government expenditure has consistently exceeded revenue, often by a considerable margin. From 1960 to 1977, expenditure was about 28 percent of GDP. After 1977 it increased, mainly as a result of investment in infrastructure. Between 1978 and 1987, the government spent around 38 percent of GDP. Of the nearly Rs70 billion spent in 1986, about half was classified as recurrent expenditure, and half as capital expenditure.
Governments have used expenditure as a tool of social policy. In comparison with other Third World countries, Sri Lanka has a long tradition of public spending on health, education, and other social services. These programs have contributed at least in part to the nation's very high levels of literacy and life expectancy relative to its per capita income (see Social Services , ch. 2). In the period between 1960 and 1977, about 9.5 percent of GDP, or one-third of the government's budget, was devoted to such programs.
After the liberalization of the economy in 1977, there were reductions in some social programs. In June 1978 the long-established system of rice rationing, which provided free and subsidized rice to nearly the entire population, was replaced by a food stamp program that covered only about 50 percent of the population. The value of the stamps was not indexed in order to keep place with inflation, and as a result the program's cost fell from 14 percent of government expenditure in 1979 to 7 percent in 1981 and 2.6 percent in 1986. Although there was a drop in the standard of living for the very poor, in early 1988 the food stamp program continued to provide a safety net more effective than programs existing in other parts of South Asia. Overall, social services, education, and welfare accounted for just under 15 percent of government spending in 1986.
Foreign aid was essential in preventing acute foreign exchange shortages after 1977. It accounted for around 9 percent of GDP from 1978 to 1986. Aid has been of two types: outright grants and loans on concessionary terms. The annual level of grants grew from US$21.9 million in 1978 to US$178 million in 1986. Most of this money was tied to specific projects, such as the Accelerated Mahaweli Program. Both grant aid and concessionary loans come from Western Europe, the United States, Japan, and international organizations. Project loans amounted to US$351.2 million in 1986, and nonproject loans were US$77.1 million.
Most foreign aid to Sri Lanka was pledged at the meetings of the Aid Sri Lanka Consortium, which was organized by the World Bank on behalf of the major donor countries. The Sri Lankan government sent the World Bank an annual request outlining its needs. The member donors then met to consider these requests and coordinate their aid policies. The World Bank and most aid donors strongly supported the liberalization of the economy during the decade after 1977; indeed, at times they have urged the government to carry its free market policies further.
A special meeting of the consortium in December 1987 pledged US$493 million above its normal aid commitments toward a three-year reconstruction program. Much of this money was targeted for specific projects in Northern and Eastern provinces. Observers believed that if there were a peaceful solution to the nation's political problems, total foreign aid would reach US$2.7 billion in the years 1988 to 1990.
In the 1960-77 period, budget deficits averaged about 8 percent of GDP. After 1977 increases in expenditures were not matched by corresponding increases in revenues, and the result was a rapid increase in the public debt. The budget deficit averaged 15 percent of GDP from 1978 to 1986. It temporarily dropped to 10.3 percent of GDP in 1984 when high tea prices caused increased revenue, but in both 1985 and 1986 it was close to 16 percent. The 1986 deficit of Rs28.1 billion was financed by Rs3.8 billion in foreign grants, Rs12.1 billion in foreign loans, and Rs11.5 billion domestic borrowing from banking and other sources. Foreign loans and grants financed about 50 percent of the budget deficits in the 1980s.
The public debt was about Rs150 billion at the end of 1986, and the total interest payments by the government in 1986 were Rs9.3 billion, or 5.2 percent of GDP. About 45 percent of the public debt was owed to domestic sources. Medium- and long-term debts accounted for 56 percent of the domestic debt, and short-term loans made up the balance. In 1986 rupee securities sold to the pension funds and the National Savings Bank accounts were the principal instrument of the domestic medium- and long-term debt. Domestic short-term financing was raised primarily through treasury bills. The majority of the foreign debt was negotiated at concessional terms (see External Debt , this ch.). In 1986 a total of Rs12 billion in new foreign loans was contracted, of which Rs9.9 billion were for specific projects. Repayments of earlier loans amounted to just over Rs3 billion. The accumulated foreign debt tended to increase annually in rupee terms in the 1980s because of the steady depreciation of the rupee in relation to the currencies of the lending nations.
The Central Bank of Sri Lanka, which started operations in 1950, stood at the apex of the country's financial framework in 1988. The bank administered the exchange control system, implemented monetary policy, and regulated the money supply through such means as open market transactions, interest rate changes, and changes in the minimum reserve requirements of the commercial banks.
The private sector relied almost entirely on the banks for credit. In early 1988, the commercial banking system consisted of twenty-six banks: six Sri Lankan banks and twenty-two foreign banks. Two of the Sri Lankan banks--the Bank of Ceylon and the People's Bank--were state banks. These institutions dominated commercial banking, holding nearly 80 percent of total deposits. The profitability of these banks, like that of many other state enterprises, had been hindered by politicians using them to secure employment for their supporters. Recovering loans due from public corporations has also been a problem for these banks.
The four private Sri Lankan banks in 1988 were the Hatton National Bank, the Commercial Bank of Ceylon, the Investment and Credit Bank, and the Agro-Commercial Bank. The last two of these banks began operations in 1987, the first local banks founded after the liberalization of the economy in 1977.
Until 1979 the presence of foreign banks consisted of three British banks (Grindlays Bank, Chartered Bank, and the Bank of Hong Kong and Shanghai), three Indian banks (State Bank of India, Indian Bank, and Indian Overseas Bank), and one Pakistani bank (Habib Bank). In 1979, for the first time in many years, foreign banks were allowed to open branches, and many American and European institutions took advantage of this policy. Newcomers included the Bank of Credit and Commerce International, Banque Indosuez, Citibank, American Express, Overseas Trust Bank, Bank of Oman, Bank of America, European Asian Bank, Algemene Bank Nederland, Chase Manhattan, Amsterdam Rotterdam Bank, Bank of the Middle East, and Bankers' Trust Company. The initial capital requirement, which had been set at Rs10 million in 1979, was increased in 1982 to Rs50 million. The Bank of America ended its activities in Sri Lanka at the end of 1986.
Although the arrival of foreign banks increased the level of competition and led to new facilities, the overall impact on the credit supply remained marginal in early 1988. Credit to the rural sector and small firms was still tight and was channeled mainly by the two state banks.
Interest rate policy in the 1980s encouraged high rates in order to combat inflation and encourage a higher flow of savings to bridge the gap between new investment and total domestic savings. At the end of 1986, treasury bills paid 11 percent and interbank loans cost between 12 percent and 12.75 percent. Loans and bank overdrafts were charged between 12 and 30 percent.
The Central Bank announced a deposit insurance program for small depositors in June 1987, but none of the commercial banks had joined at the end of the year. Only deposits of private individuals up to a value of Rs100,000 could be insured. Government, interbank, and local government deposits were not eligible. Banks that joined would pay four Sri Lankan cents for every Rs100 to the Central Bank. The Central Bank hopes that the confidence created by the program will offset the extra costs to the banks.
In late 1987, the Central Bank offered the commercial banks a number of incentives to join the insurance scheme, including lowering their reserve requirement to a flat rate of 10 percent. In 1987 the ratio was 18 percent on checking account deposits, 14 percent on fixed-term deposits, and 10 percent on other deposits.
The stock market, which was established in December 1985, was a minor source of capital. At the end of 1986, it quoted 173 companies having a total market capitalization of around Rs14 billion. Share transactions averaged Rs2.5 million a week. In 1987 legislation established a securities council to regulate the stock exchange. The proposed council was to be empowered to grant licenses to stockbrokers, set up a fund to compensate investors who suffered losses resulting from the failure of a licensed dealer to meet contractual obligations, and suspend or cancel the trading of securities for the protection of investors. The intent of this legislation was to create confidence in the stock market in the hope that it would attract more investors.
Abb.: Touristen in Negombo, 2005
[Bildquelle: john worsley uk. --
http://www.flickr.com/photos/johndunster/57130022/. -- Creative Commons
Lizenz (Namensnennung, keine Bearbeitung). -- Zugriff am 2006-06-25]
In 1966 the government established the Ceylon Tourist Board, vesting in it the responsibility for invigorating the tourist industry. The board, operating as an autonomous corporation, was charged with promotional as well as organizational responsibilities. Most provisions for tourists were in the private sector, but the board had facilities in areas where private ones were considered inadequate.
Tourism expanded rapidly after 1966. The main attractions are the beach resorts of the southwestern coastal region, but many tourists also visit the ancient cities of the dry zone, the historic city of Kandy, and the mountainous region dominated by tea plantations. Between 1976 and 1982, the number of tourist arrivals increased at an annual rate of almost 24 percent, reaching a peak of 407,230 before declining to 337,342 arrivals in 1983 as a result of the Tamil insurgency. More than half the arrivals were from Western Europe.
Serious civil disturbances starting in July 1983 and the subsequent violence badly affected tourism. Total arrivals were 230,106 in 1986, down 43 percent from 1982. To ease the plight of the industry, the government provided various concessions to hotels, such as the rescheduling of loans and the reduction of the turnover tax from 10 percent to 5 percent. The Ceylon Tourist Board also undertook a crash promotion program in an attempt to restore the island's image in world tourist markets. Tourist arrivals in the first six months of 1987, however, showed a decline of 23 percent compared with the same period the previous year. In early 1988, the outlook was for further contraction.
In 1988 it remained unclear whether the policies of economic liberalization Sri Lanka has pursued since 1977 would succeed in their principal goals of employment, wealth creation, and economic diversification. Although increased rice production, the growth of textile manufacturing, and an improved infrastructure were successes that could be attributed to the post-1977 policies, these gains came at the cost of a mounting foreign and domestic debt and declining living standards for the poor. In the mid-1980s, the declining security situation began to have an increasingly negative impact on the economy, and in early 1988 economic prospects for the 1990s appeared to be linked at least in part to a resolution of the ethnic conflict.
The most current and easily accessible sources on the Sri Lankan economy are two publications of the Economist Intelligence Unit in London: Country Profile: Sri Lanka, an annual survey of the economy; and Country Report: Sri Lanka, a quarterly publication that includes the latest economic information. For agriculture, the annual South Asia: Situation and Outlook Report, published by the Economic Research Service of the U. S. Department of Agriculture, is also useful and makes use of detailed information found in two annual publications of the Central Bank of Sri Lanka, the Annual Report of the Central Bank of Sri Lanka and the Review of the Economy.
No book-length general survey of the Sri Lankan economy appeared in the decade after the change of economic direction in 1977, and the earlier works, although valuable for historical background, are out of date. The various essays in Sri Lanka: A Survey edited by K. M. de Silva portray the course of the economy from independence to the mid-1970s. A critical analysis of the post-1977 economic policies is Ronald Herring's "Economic Liberalization Policies in Sri Lanka: International Pressures, Constraints and Supports." A more favorable evaluation of these policies is by Surjit S. Bhalla and Paul Glewwe, "Growth and Equity in Developing Countries: A Reinterpretation of the Sri Lankan Experience." This reference should be read in conjunction with the rebuttals by Paul Isenman and Graham Pyatt in World Bank Economic Review. (For further information and complete citations, see Bibliography).
Zu Kapitel 4: Government and politics